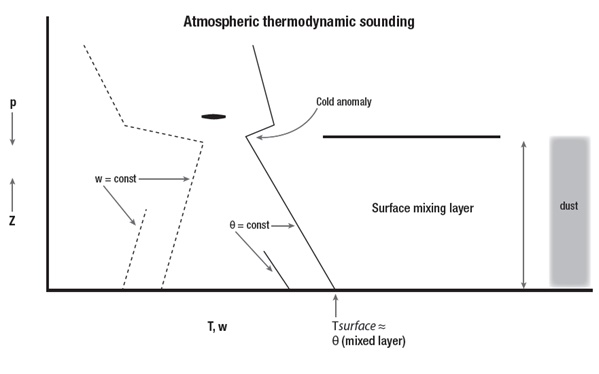
Fig. (1)
Schematic atmospheric sounding (Skew-T diagram) showing a pair of vertical profiles of temperature (T; solid lines, right profile) and water vapor mixing ratio (w; dotted lines, left profile) versus height (z) or pressure (p). Isopleths of constant potential temperature (θ), illustrated by the solid line segment, slope upward to the left, and mixing ratio (w), illustrated by the dashed line segment, slope upward to the right. The surface mixing layer, that of a layer of constant potential temperature and water vapor mixing ratio, and its attendant dust content (shading) are labeled, as is the cold anomaly referred to in the text. The elliptical blob just above the mixing layer denotes the level at which condensation would occur if the mixing layer were to extend (or be lifted) to that height.

