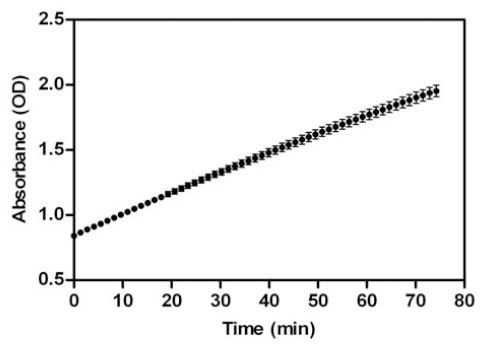
Fig. (2) Reaction time course. Absorbance (optical density) was recorded over time for six replicate reactions initiated at time 0. Serum concentration was 15%. Error bars represent standard deviations. Data are representative of two independent experiments.