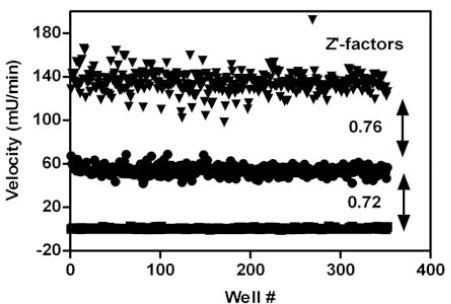
Fig. (5) Serum paraoxonase assay variability assessment. All wells of a 384-well plate, except for two columns used as controls, were pre-spotted with 0.5 µl of DMSO. The pre-spotted DMSO plates simulated compound plates to be screened. One plate each was used to determine the maximum signal (●), minimum signal using EDTA (■), and a 2x serum concentration (▲) to mimic 2x activation of enzymatic activity. The variability for inhibition was determined using the max and min plates while the activation window was determined based on the max and 2x plates. The Z’-factors for the inhibition assay window and the activation assay window are provided. Data are representative of two independent experiments.