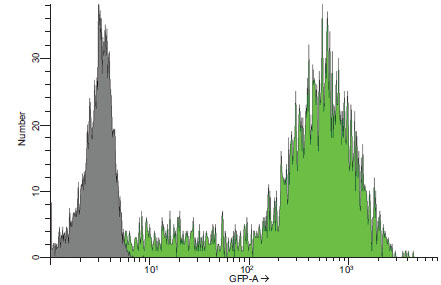
Fig. (1) Fluorescence intensity profile of GFP expressing NS-1 cells. A flow cytometry histogram showing the profile of a mixed population of GFP expressing NS-1 cells (green shading) relative to the population of untransfected NS-1 cells (gray shading). In this example, 80% of the NS1-GFP population exhibited an intensity of at least 10 times that of the control population.