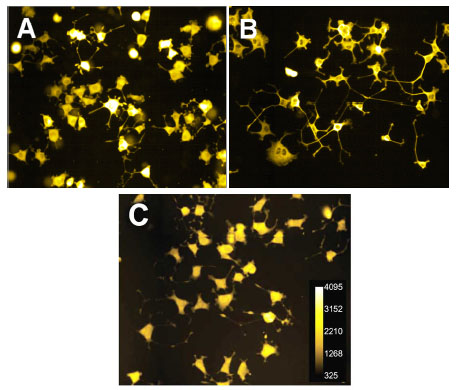
Fig. (2) A comparison of fluorescent images generated by the three staining methods. GFP-NS-1cells (A), βIII-tubulin immunofluorescence (B) and HCS CellMask™ Red (C) fluorescence images of cell bodies and neurites were acquired on the BD Pathway 855 Bioimager. Unaltered, exemplar TIFF files were retrieved with “ImageJ” software and the “Yellow Hot” look-up table was used to determine relative intensities; no other data manipulations were applied. A gray scale ramp is shown in panel C.