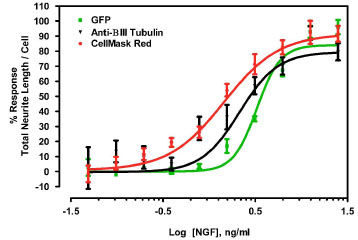
Fig. (3) Comparison of NGF dose on neurite outgrowth response measured by three visualization methods. NS-1 cell neurites were visualized by transfection with GFP (GFP), staining with anti-βIII-tubulin followed by DyLight 488-conjugated secondary antibody (anti-βIII tubulin) or staining with CellMask Red (CellMask Red). Data were normalized using responses to 0ng/ml and 50ng/ml NGF as minimum and maximum total neurite length/cell, respectively. Calculated EC50 values were 3.3, 2.1 and 1.4 ng/ml using GFP, anti-βIII-Tubulin and CellMask Red, respectively. Values plotted are means ± S.E.M. (n=4).