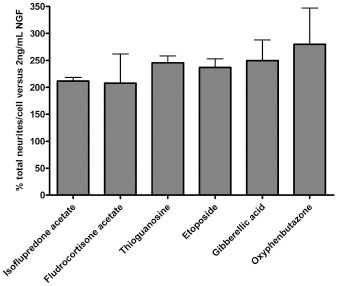
Fig. (5) Active compounds exhibiting greater than 200% activity in two separate experiments. NS1 cells were treated with 2 ng/mL NGF in the presence of 1.5 µM compounds for 48 h and stained with a cocktail of Hoechst and HCS CellMask Red™ for 30 min. Data was acquired on the BD Pathway855 imaging station and analyzed with BD Attovision™ 1.6 software. The histograms represent the compound activity measured as total neurites per cell over background of 2 ng/mL NGF in two independent experiments; the error bars represent standard deviations.