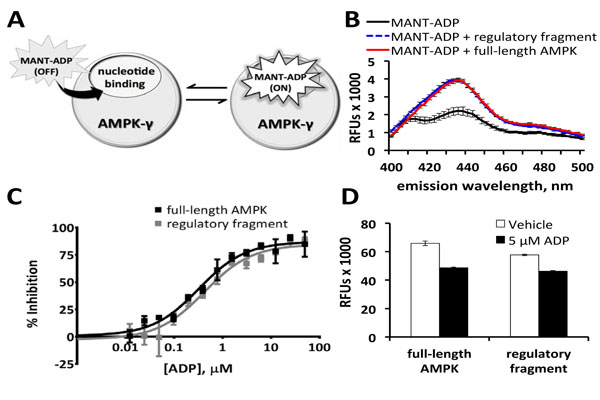
Fig. (1) ADP competes with MANT-ADP for binding to AMPK. (A) Simplified cartoon showing MANT-ADP fluorescence increasing
upon binding to protein. AMPK-α and AMPK-β subunits and additional nucleotide-binding sites are omitted for clarity. (B) MANT-ADP
fluorescence increased after addition of regulatory fragment or full-length AMPK (excitation = 360 nm). Background fluorescence from
protein was subtracted from raw data prior to plotting the corrected spectra shown above. A 460 nm emission filter was used for subsequent
experiments. (C) ADP inhibited the increase in MANT-ADP fluorescence. (D) Full-length AMPK provided a slightly greater assay window.
Z’-factors > 0.6. (B-C) n = 5 wells per data point. (D) n = 6 wells per data point. Data points are mean ± standard deviation. Some of the
standard deviations are too small to be visible when plotted on this scale. RFUs, relative fluorescence units.