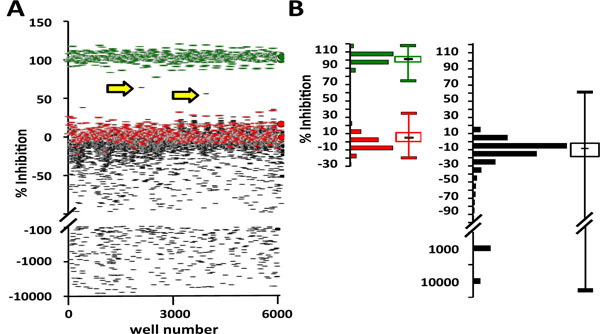
Fig. (4) (A) In a set of sixteen plates from the small molecule library, two of 5120 molecules inhibited MANT-ADP fluorescence by more than
50% (yellow arrows). Each plate included 32 positive and 32 negative controls (green and red circles, respectively). Negative inhibition most
likely indicates small molecule autofluorescence. Many of the autofluorescent molecules were plotted on a logarithmic y-axis to conserve space.
The average Z’-factor for the plates shown above is 0.58. (B) Histograms and box plots show distribution statistics for the positive control ADP
(green), vehicle (red), and library molecules (black). Whiskers indicate the range; boxes indicate data between the first and third quartile.