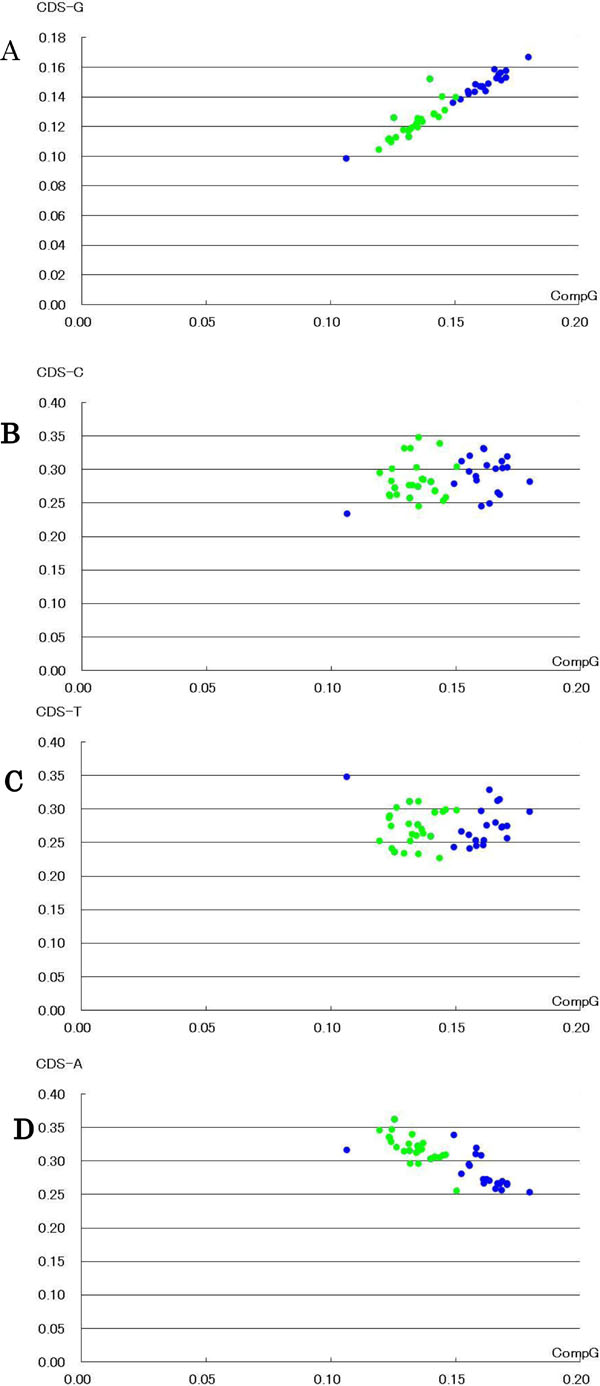
Fig. (1) Nucleotide relationships in normalized vertebrate mitochondrial
values. The vertical axis represents G, C, T and A contents
of the coding region on graphs A, B, C and D, respectively.
The horizontal axis represents G content of the complete mitochondrial
genome. Green and blue represent terrestrial and aquatic vertebrates,
respectively. Statistical differences between terrestrial and
aquatic vertebrates were evaluated using a student’s t-test. G content
in the complete mitochondrial genome, p < 0.01, and in the
coding region, G content; p < 0.01, C content; p > 0.05, T content;
p > 0.05, A content; p < 0.01