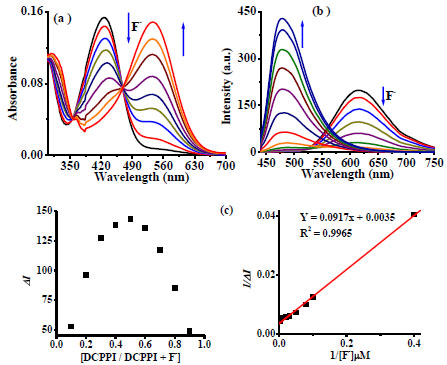
Fig. (5)
(
a
) Absorption (5µM) and (
b
) emission (1.5µM) titration spectra of
DCPPI
upon addition of (0-9 Equiv) and (0-30 Equiv) of F- anions, respectively in MeCN. (
c
) Job’s plot and Benesi-Hildebrand plots obtained from emission spectral data.