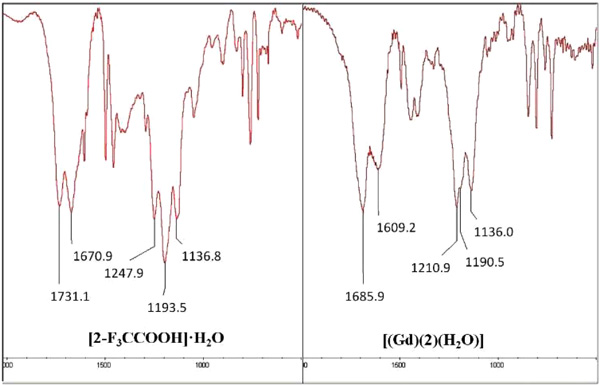
Fig. (7c)
Regions FTIR spectra of compound ([2-F
3
CCOOH]•H
2
O) (upper) and complex and complex [Gd(2)(H
2
O)n] (bottom).