- Home
- About Journals
-
Information for Authors/ReviewersEditorial Policies
Publication Fee
Publication Cycle - Process Flowchart
Online Manuscript Submission and Tracking System
Publishing Ethics and Rectitude
Authorship
Author Benefits
Reviewer Guidelines
Guest Editor Guidelines
Peer Review Workflow
Quick Track Option
Copyediting Services
Bentham Open Membership
Bentham Open Advisory Board
Archiving Policies
Fabricating and Stating False Information
Post Publication Discussions and Corrections
Editorial Management
Advertise With Us
Funding Agencies
Rate List
Kudos
General FAQs
Special Fee Waivers and Discounts
- Contact
- Help
- About Us
- Search


Open Chemistry Journal
(Discontinued)
ISSN: 1874-8422 ― Volume 8, 2021
Preparation, Characterization and Antioxidant Evaluation of Cu(II) and Zn(II) Tannates
Gessyca G. Costa1, Camila C.S.M. Brito2, Ailton J. Terezo2, Adriana P. Cardoso2, Elias Y. Ionashiro3, Adriano B. de Siqueira2, *
Abstract
Introduction:
The interest in the antioxidant materials increased due to their free radical scavenging properties avoiding various pathologies. Tannic Acid (TA) is known to have high free radical scavenging activity, but its application is still limited.
This paper had the objective of synthesis, characterization and evaluation of free radical scavenging activity of TA associated with Cu (II) and Zn (II) ions, in a buffered aqueous medium.
Methods and Materials:
Techniques of FTIR, simultaneous TG-DSC characterized the obtained compounds, and the evaluation of free radical scavenging activity was made using 2,2–diphenyl–1–picrylhydrazyl (DPPH) radical. The FTIR analysis of the compounds showed significant displacement of the main bands in the TA spectrum (νC=O, δO-H, σO-H), suggesting an association of metal ions with the oxygen of the hydroxyl group of TA. TG-DSC curves showed information about the thermal stability, stoichiometry, hydration water, and residues formation.
Results and Conclusion:
The TA association with the metal ions Cu(II) and Zn(II) decreased the antioxidant activity of the molecule significantly, showing that these compounds could be potentially used as pro-oxidant agents.
Article Information

Identifiers and Pagination:
Year: 2018Volume: 5
First Page: 158
Last Page: 171
Publisher Id: CHEM-5-158
DOI: 10.2174/1874842201805010158
Article History:
Received Date: 6/6/2018Revision Received Date: 7/11/2018
Acceptance Date: 18/11/2018
Electronic publication date: 24/12/2018
Collection year: 2018
open-access license: This is an open access article distributed under the terms of the Creative Commons Attribution 4.0 International Public License (CC-BY 4.0), a copy of which is available at: https://creativecommons.org/licenses/by/4.0/legalcode. This license permits unrestricted use, distribution, and reproduction in any medium, provided the original author and source are credited.
* Address correspondence to this author at the Department of Chemistry, Federal University of Mato Grosso (UFMT), Rua Consolação, n. 321, Coophema, Cuiabá, Mato Grosso, Brazil; Tel: 6584357708; E-mail: buzutti7@hotmail.com
| Open Peer Review Details | |||
|---|---|---|---|
| Manuscript submitted on 6-6-2018 |
Original Manuscript | Preparation, Characterization and Antioxidant Evaluation of Cu(II) and Zn(II) Tannates | |
1. INTRODUCTION
The imbalance of oxidant compounds and antioxidants cause the formation of reactive species responsible for various damages in our body, which can result in irreversible pathological processes such as degenerative diseases, cancer, cardiovascular diseases, as well as the aging of cells and tissues [1Birben, E.; Sahiner, U.M.; Sackesen, C.; Erzurum, S.; Kalayci, O. Oxidative Stress and Antioxidant Defense. World Allergy Organ. J., 2012, 5, 9-19.
[http://dx.doi.org/10.1097/WOX.0b013e3182439613] , 2Elmasry, S.A.; Al-Azzawi, M.A.; Ghoneim, A.H.; Nasr, M.Y.; AboZaid, M.M.N. Role of oxidant–antioxidant imbalance in the pathogenesis of chronic obstructive pulmonary disease. Egypt. J. Chest Dis. Tuberc., 2015, 64, 813-820.
[http://dx.doi.org/10.1016/j.ejcdt.2015.06.001] ]. The research for new antioxidant materials is growing with the purpose of benefiting human health.
Sungur and Uzar [3Sungur, S.; Uzar, A. Investigation of complexes tannic acid and myricetin with Fe(III). Spectrochim. Acta A Mol. Biomol. Spectrosc., 2008, 69(1), 225-229.
[http://dx.doi.org/10.1016/j.saa.2007.03.038] [PMID: 17493867] ] described the efficiency of Tannic Acid (TA) as an antioxidant compound. This compound can act in radical species, blocking the increase of the oxidative damage. Some authors have been suggested that the structural characteristics of TA, which are important in the antioxidant mechanisms, can be better used in pro-oxidant activities [3Sungur, S.; Uzar, A. Investigation of complexes tannic acid and myricetin with Fe(III). Spectrochim. Acta A Mol. Biomol. Spectrosc., 2008, 69(1), 225-229.
[http://dx.doi.org/10.1016/j.saa.2007.03.038] [PMID: 17493867] ]. This compound can act in radical species, blocking the increase of the oxidative damage. Some authors have suggested that the structural characteristics of TA, which are important in the antioxidant mechanisms, can be better used in pro-oxidant activities [4Choi, J.M.; Han, J.; Yoon, B. Antioxidant properties of tannic acid and its inhibitory effects on paraquat induced oxidative stress in mice. Food Sci. Biotechnol., 2006, 15, 728-734.].
The TA, due to the presence of a significative number of Hydroxyl groups, can complex with several metals as Aluminium [5Khan, N.S.; Ahmad, A.; Hadi, S.M.; Khan, N.S. Anti-oxidant, pro-oxidant properties of tannic acid and its binding to DNA. Chem. Biol. Interact., 2000, 125(3), 177-189.
[http://dx.doi.org/10.1016/S0009-2797(00)00143-5] [PMID: 10731518] ], Copper [6Fu, L.; Liu, F.; Ma, Y.; Tao, X.; Ling, C.; Li, A.; Shuang, C.; Li, Y. High-efficient technique to simultaneous removal of Cu(II), Ni(II) and tannic acid with magnetic resins: Complex mechanism behind integrative application. Chem. Eng. J., 2015, 263, 83-91.
[http://dx.doi.org/10.1016/j.cej.2014.11.041] -9Chakrabarty, T.; Pérez-Manríquez, L.; Neelakanda, P.; Peinemann, K.V. Bioinspired tannic acid-copper complexes as selective coating for nanofiltration membranes. Separ. Purif. Tech., 2017, 184, 188-194.
[http://dx.doi.org/10.1016/j.seppur.2017.04.043] ], Iron [3Sungur, S.; Uzar, A. Investigation of complexes tannic acid and myricetin with Fe(III). Spectrochim. Acta A Mol. Biomol. Spectrosc., 2008, 69(1), 225-229.
[http://dx.doi.org/10.1016/j.saa.2007.03.038] [PMID: 17493867] , 10Çakar, S.; Özacar, M. Fe-tannic acid complex dye as photosensitizer for different morphological ZnO based DSSCs, Spectrochim. Acta - Part A Mol. Biomol. Spectrosc., 2016, 163, 79-88.
[http://dx.doi.org/10.1016/j.saa.2016.03.031] [PMID: 27043871] , 11Brito, C.C.S.M.; Cardoso, A.P.; Caires, F.J.; Siqueira, A.B. Characterization and thermal behavior of tannic acid compounds with Fe(II) and Co(II) in solid state. Brazilian J. Therm. Anal., 2015, 4, 6.
[http://dx.doi.org/10.18362/bjta.v4.i1-2.60] ], Cobalt [11Brito, C.C.S.M.; Cardoso, A.P.; Caires, F.J.; Siqueira, A.B. Characterization and thermal behavior of tannic acid compounds with Fe(II) and Co(II) in solid state. Brazilian J. Therm. Anal., 2015, 4, 6.
[http://dx.doi.org/10.18362/bjta.v4.i1-2.60] ] and Zinc [12]. The metal ions can act as an intra/ inter chelating agent with TA [3Sungur, S.; Uzar, A. Investigation of complexes tannic acid and myricetin with Fe(III). Spectrochim. Acta A Mol. Biomol. Spectrosc., 2008, 69(1), 225-229.
[http://dx.doi.org/10.1016/j.saa.2007.03.038] [PMID: 17493867] , 6Fu, L.; Liu, F.; Ma, Y.; Tao, X.; Ling, C.; Li, A.; Shuang, C.; Li, Y. High-efficient technique to simultaneous removal of Cu(II), Ni(II) and tannic acid with magnetic resins: Complex mechanism behind integrative application. Chem. Eng. J., 2015, 263, 83-91.
[http://dx.doi.org/10.1016/j.cej.2014.11.041] , 7Kraal, P.; Jansen, B.; Nierop, K.G.J.; Verstraten, J.M. Copper complexation by tannic acid in aqueous solution. Chemosphere, 2006, 65(11), 2193-2198.
[http://dx.doi.org/10.1016/j.chemosphere.2006.05.058] [PMID: 16837024] , 9Chakrabarty, T.; Pérez-Manríquez, L.; Neelakanda, P.; Peinemann, K.V. Bioinspired tannic acid-copper complexes as selective coating for nanofiltration membranes. Separ. Purif. Tech., 2017, 184, 188-194.
[http://dx.doi.org/10.1016/j.seppur.2017.04.043] , 13]. Few studies report the free radical scavenging activity of TA associated with metal ions [14Wu, S.J.; Ho, Y-C; Jiang, S.Z.; Mi, F.L. Effect of tannic acid–fish scale gelatin hydrolysate hybrid nanoparticles on intestinal barrier function and α-amylase activity. Food Funct., 2015, 6, 2283-2292.
[http://dx.doi.org/10.1039/c4fo01015a] ].
The knowledge of the properties of TA and the importance of developing new antioxidant or pro-oxidant agents motivated the development of this work. Therefore, the antioxidant properties of TA were studied after its association with bivalent copper and zinc ions, in a redox system with DPPH.
2. MATERIALS AND METHODS
Tannic Acid (TA), C76H52O46 (99% purity), used for the synthesis of TA-Cu (II) and TA-Zn (II), was from Carlo-Erba company. Other used reagents were of analytical grade.
Solutions with 0.1 mol L-1 concentration were prepared by direct weighing of TA and the salts Cu(NO3)2.3H2O and ZnCl2. The solution´s pH was set to 5.5 (Zn (II) and Cu (II)) and 8.0 (TA solution) with a buffer solution 2.0 mol L-1, respectively, of ammonium acetate and NH3/NH4Cl.
The compounds TA-Cu (II) and TA-Zn (II) were prepared by adding the solution of the ligand to the respective metal solution, in the ratio of 1:1 and 1:5 (metal: TA), using continuous stirring. The resulting systems were filtered on Whatman n. 40 filter paper and washed with distilled water until elimination of the chloride (or nitrate) ions. The obtained products were dried on a heater at 50ºC and kept in a desiccator over anhydrous calcium chloride.
The TA-Cu (II) compounds in a buffer solution at pH 5.5 with the 1:1 stoichiometric metal:TA ratio were called as A1, and 1:5 were called as A2. The compounds prepared in a buffer solution at pH 8.0 with the 1:1 stoichiometric metal:ligand ratio were called as A3 and 1:5 were called as A4.
The TA-Zn (II) compounds prepared in a buffer solution at pH 5.5 with the 1:1 stoichiometric Metal:TA ratio were called as A5, and 1:5 were called as A6. The compounds prepared in a buffer solution at pH 8.0 with the 1:1 stoichiometric metal:ligand ratio were called as A7 and 1:5 were called as A8.
2.1. Characterization Technique
Infrared analysis (FTIR) of the TA, as well as the synthesized compounds, were made on a PerkinElmer Spectrum 100 spectrometer, with a resolution of 4 cm-1, in 4000-600 cm-1 region, using the Attenuated Total Reflectance (ATR) technique.
Simultaneous TG–DSC curves were obtained on a TG/DSC-1 from Mettler Toledo. The purge gas was air flow with the flow rate of 60 mL min-1. A heating rate of 20 ºC min-1 was adopted, with sample weighing about 7 mg in the temperature range of 30-1000 ºC. Alumina crucibles were used for this analysis.
2.2. Antioxidant Activity
2.2.1. Solubility Tests
The solvents used in the analysis of antioxidant potential with DPPH were chosen according to the qualitative solubility analysis of the synthesized compounds. The solvents were the following: ethyl acetate-ethanol, petroleum ether, hexane and methanol.
The activity of antioxidant was estimated with the stability of free radical 2,2-diphenyl-1-picrylhydrazyl (DPPH), using a modified methodology based on the one described by [12].
The UV-Vis spectroscopy was performed on a Lambda 25 Perkin Elmer UV-Vis spectrometer using the selected wavelength of 515 and 517 nm. The evaluation of scavenging free radical activity was expressed as the percentage (%) of TA amount.
2.2.2. Analytical Curve for DPPH
The methanolic stock solution of DPPH100 µg mL-1 was prepared and kept under cooling at 5 ºC, in the absence of light. Working solutions (60, 50, 40, 30, 20, 10 and 5 μg mL-1) were prepared from the stock solution immediately before to use in the assays.
The analytical curve was obtained by measurements of absorbance values of the diluted solutions(5 to 60 μg mL-1) in the wavelength of 515 nm, using a quartz cuvette with an optical depth of 1 cm-1, and methanol as blank. Measurements were made in triplicates for each sample for 3 minutes. This procedure was used to verify if there was any degradation of the sample during the absorbance analysis [13]. This procedure was repeated using ethanol and ethyl acetate as solvents, using the maximum absorbance value at 517 nm.
3. EXPERIMENTAL
3.1. Absorbance Measures from Samples
For the synthesized compounds analysis, solutions of TA-Cu (II) and TA-Zn (II) were prepared using the concentrations of 0.16; 0.12; 0.08 and 0.04 g L-1 using for each set of experiments a different solvent (Ethyl acetate, methanol and ethanol). The solutions were kept for 30 minutes on water-bath under 60ºC, to increase the solubility of the compounds. The resultant solution was transferred to a 25 mL volumetric flask. For each 2.50 mL of sample, 1.00 mL of DPPH solution (60 µg mL-1) was added.
A negative control was prepared using the same procedure, without the addition of DPPH. This solution was used as a blank and its absorbance values were obtained by triplicate analysis.
A DPPH solution was left resting for 20 minutes, protected from light, to evaluate a possible degradation of the sample over time. The absorbance measures were made at 515 nm for methanol and 517 nm for ethanol and ethyl acetate, for each sample. The measures were realized 31 minutes after the preparation of the sample, and it was repeated after 35, 40, 50, 60, 70, 80 and 90 minutes, after the preparation of the samples [13].
From the analytical curve equation and data obtained from the proposed times for each evaluated concentration, the percentage and concentration of the reminiscent DPPH (%DPPHREM), were calculated according to equation 1 [13].
 |
(1) |
[DPPH]T=t represents DPPH concentration after the reaction with the sample and [DPPH]T=0 is the initial concentration of DPPH (60 µL mL-1) [12].
The absorbance values for all concentrations in 30, 60 and 90 minutes were converted in antioxidant activity % (%AA), according to equation 2 [13, 15Moreira, D.D.L.; Leitão, S.G.; Gonçalves, J.L.S.; Wigg, M.D.; Leitão, G.G. Antioxidant and antiviral properties of Pseudopiptadenia contorta (Leguminosae) and of quebracho (Schinopsis sp.) extracts. Quim. Nova, 2005, 28, 421-425.
[http://dx.doi.org/10.1590/S0100-40422005000300011] ].
 |
(2) |
Abscontrol represents the initial absorbance of the DPPH solution, and Abssample represents the reactional mixture absorbance (DPPH + sample) [13, 15Moreira, D.D.L.; Leitão, S.G.; Gonçalves, J.L.S.; Wigg, M.D.; Leitão, G.G. Antioxidant and antiviral properties of Pseudopiptadenia contorta (Leguminosae) and of quebracho (Schinopsis sp.) extracts. Quim. Nova, 2005, 28, 421-425.
[http://dx.doi.org/10.1590/S0100-40422005000300011] ].
4. RESULTS AND DISCUSSIONS
4.1. Fourier Transform Infrared Spectroscopy (FTIR)
The FTIR spectra were made to characterize the compounds of TA-Cu (II) and TA-Zn (II). The obtained spectra were suggesting some vibrational bands of the compounds, and they allow to evaluate the types of interactions between the metal ion and TA.
The FTIR spectrum of the TA, (Fig. 1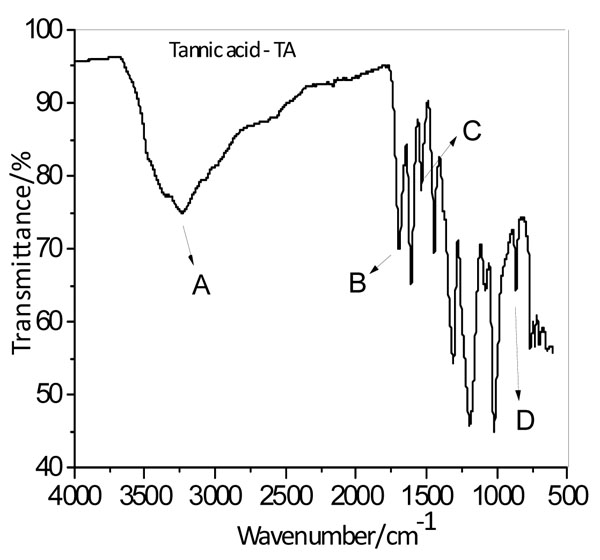 ), indicate that the main vibrational bands on TA are: C=O, OH, C-O, H-C and C=C stretch, as well as C-O-H in-plane and out-of-plane bending. A wide band between 2870-3670 cm-1 was assigned to O-H stretch from hydrogen bonds. The in-plane bending of C-O-H group occurs at 1610-1535 cm-1, and the out-of-plane bending was assigned to 872 cm-1. The characteristic peak at 1708 cm-1 was assigned to the Carbonyl vibrations of TA. The attributions of the vibrational bands of TA agree with the literature [10Çakar, S.; Özacar, M. Fe-tannic acid complex dye as photosensitizer for different morphological ZnO based DSSCs, Spectrochim. Acta - Part A Mol. Biomol. Spectrosc., 2016, 163, 79-88.
[http://dx.doi.org/10.1016/j.saa.2016.03.031] [PMID: 27043871] ].
The FTIR of the TA-Cu (II) and TA-Zn (II) in 1:1 and 1:5 ratios, in buffered pH of 5.5 and 8.0 are shown in Fig. (2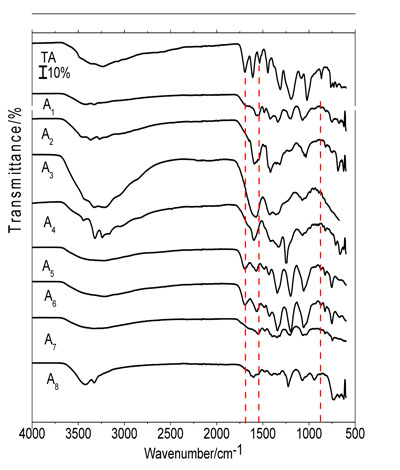 ).
).
For all FTIR spectra of TA-Cu (II) shown in Fig. (2), were observed a significant shift in the bands assigned to C=O stretching and O-H in-plane and out-of-plane bending. The C=O stretch shifted to 1567 cm-1 (A1), 1591 cm-1 (A2), 1583 cm-1 (A3) and 1594 cm-1 (A4). The C-O-H in-plane bending shifted to 1486-1423 cm-1 (A1), 1400-1309 cm-1 (A2), 1423-1345 cm-1 (A3) and 1425-1300 cm-1 (A4), and the C-O-H out-of-plane bending to 877 cm-1 of the TA to 751 cm-1 (A1), 826 cm-1 (A2), 690 cm-1 (A3) and 823 cm-1 (A4).
 |
Fig. (1) FTIR spectrum from TA. Where A: O-H stretching, B C=O stretching, C: O-H in-plane bending e D O-H out-of-plane bending. |

The evaluation of the C=O stretch indicates a direct rate of its intensity with the amount of Cu (II) added in buffered pH of 5.5 and an inverse proportional in buffered media of pH 8.0 causing a band with high intensity in A3.
The bands assigned to the in-plane bending were shifted when more metal ions were added. A reduction in the band related to the O-H stretch is observed, suggesting an attenuation of the strength of the intermolecular hydrogen bonds with water. These shifts indicate a new interaction of oxygen of the TA with Cu (II).
In TA-Zn (II) compounds in buffered pH of 5.5, in 1:1 and 1:5 ratio (A5 and A6), only the C-O-H in-plane bending (1579-1483 cm-1 for A5 and 1564-1483 cm-1 for A6) and out-of-plane bending, (826 cm-1 in A5 and A6 compounds) bands were shifted. Differently, the same compounds in buffered pH of 8 (A7 and A8), showed that the C=O stretch when compared with the FTIR spectrum of TA, shifted from 1696 cm-1 to 1549 cm-1 (A7) and 1597 cm-1 (A8), in-plane bending of C-O-H shifted to 1477-1390 cm-1 (A7) and 1477-1342 cm-1 (A8). Out-of-plane bending in C-O-H takes on wavenumber at 829 cm-1 (A7) and 690 cm-1 (A8). For this compound, using 1:1 ratio (A7) it was observed an increase in the relative intensity of the C=O stretching and A8 a higher intensity in O-H stretching region in 3670-2870 cm-1.
The TA and the synthesized compounds FTIR spectra suggest coordination between the ligand and the metal ion. Distinct alterations are observed in the region assigned to the carbonyl group which was shifted to a lower wavenumber in the synthesized compound in comparison with the TA. This observation can indicate a coordination metal-TA occurs between metal ion and oxygen of the carbonyl group and hydroxyl groups.
4.2. Thermal Analysis
The TG-DSC was used to evaluate the stoichiometric ratio of the metal ion to the TA, as well as the water content and the thermal behavior of the compounds TA-Cu (II), TA-Zn (II) and TA.
The simultaneous TG-DSC curves of TA are shown in Fig. (3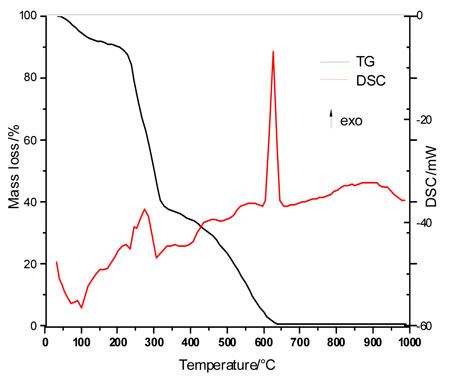 ). These curves show 4 steps of mass loss, with its thermal events shown in the DSC curve. The first mass loss occurs between 20 and 210 ºC, corresponding with the endothermic peak at 110 ºC, and assigned to the thermal dehydration of 11 molecules of water (ΔmTG=10.52%; ΔmCalcd.=10.43%). The second step of thermal decomposition corresponds to the dehydroxylation of TA between 210-266 ºC (ΔmTG=23.50%; ΔmCalcd.=22.37%). The third and fourth steps of mass loss are assigned to the oxidative degradation of TA between 266-330 °C and 330-640 °C (ΔmTG=65.98%; ΔmCalcd.=66.20%), with two exotherms between 420-590 °C and an exothermic peak at 640 ºC.
 |
Fig. (3) Simultaneous TG-DSC curve of TA. |
The thermoanalytical results for the synthesized compounds are shown in Table 1. The results suggest that the stoichiometry of the compounds are according to the general formula (M)xLn.H2O, where M is the metal ion, L is TA and n is the hydration water number. The stoichiometry of these compounds shows that the relationship M-L of the precipitate is not related to the initial concentration of the metal solution, but is related to a maximum amount of metal for each ligand molecule.
In comparison with the literature results, it can be observed that the buffered system (pH = 5.5 and 8.0) helped in the formation of zinc compounds, which was not obtained in other papers, due to the formation of zinc hydroxide [10Çakar, S.; Özacar, M. Fe-tannic acid complex dye as photosensitizer for different morphological ZnO based DSSCs, Spectrochim. Acta - Part A Mol. Biomol. Spectrosc., 2016, 163, 79-88.
[http://dx.doi.org/10.1016/j.saa.2016.03.031] [PMID: 27043871] ].
Although the proportions of 1:1 and 1:5 were controlled in the experiments, a stoichiometric relation up to 5 times was observed for zinc compounds and up to 10 times in copper compounds in comparison with the pre-established quantities. This fact is due to the presence of 10 carboxylic and 20 hydroxyl groups in each TA, increasing the coordination sites of TA.
The increase of the pH improved the stoichiometric relationship between zinc and TA, on the other hand the same relationship decreased for copper compounds, as the pre-established relationship in pH 8.0, maintained its values close to the ones obtained for other situations, indicating that the copper interaction with TA is stronger than the other studied compounds. The TA dehydroxylation in metal-compounds could not be calculated, due to the presumable interaction with the hydroxyl group with the metal, which increases its thermal stability and causes this event to overlap with the oxidative degradation of the remaining TA molecule.
Each compound has shown a very characteristic TG – DSC profile. Although final temperatures of the thermal decomposition of the compounds have been different, the final residue formed was the same, as indicated in Table 2 and Fig. (4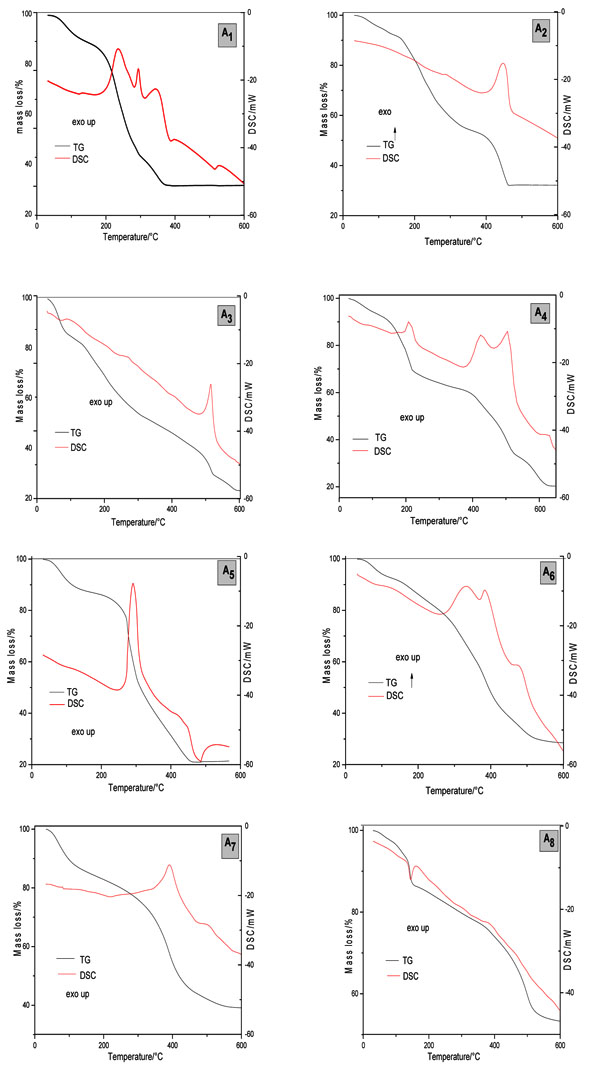 ).
).
The A1 compound has shown the molecular formula of Cu10.5L.15H2O and has shown that the thermal decomposition occurs in four consecutive steps (Table 2). DSC curve showed three exothermic peaks at 235 °C, 293 °C and 344 °C relative to TA oxidation.
The A2 compound had its molecular formula determined as Cu9.5L.11H2O, and it has shown a similar thermal decomposition in comparison with A1. The thermal decomposition of A2 shows the same number of steps of A1 but final temperature higher than A1, besides an exothermic peak at 450 ºC which indicates the oxidation of the organic matter.
The A3 has the molecular formula of Cu7.5L.20H2O, has shown that the thermal decomposition occurs consecutively in five steps of mass losses with an exothermic peak at 515 ºC. The compound synthesized in buffered pH of 8.0 (A4) with the molecular formula of Cu5.5L.10H2O had its thermal decomposition in five steps more defined in comparison with the compound synthesized at buffered pH of 5.5. The DSC curve of A4 was observed four exothermic peaks at 208 ºC, 424 ºC, 505 ºC and 630 ºC.
 |
Fig. (4) Simultaneous TG-DSC curves of TA-Cu(II) and TA- Zn(II). |
The TA-Zn compound with 1:1 ratio and buffered pH of 5.5 (A5) had its molecular formula determined as Zn6.5L.15H2O and had its thermal decomposition in three consecutive steps of mass loss with an exothermic peak at 290 ºC and an exotherm between 400-490 ºC, indicating the oxidation of the organic matter. The A6 presented the molecular formula of Zn8L.9.5H2O and had shown a different behavior, with its thermal decomposition in 6 steps of mass loss with exothermic peaks at 140 °C, 335 °C and 390 °C and two endothermic peaks at 332 °C, 385 ºC and 476 °C.
The TA-Zn compound with 1:5 ratio and buffered pH of 5.5 (A7) with the molecular formula of Zn14L.21.H2O had its thermal decomposition in three steps of mass loss with an endothermic peak at 219 ºC and two exothermic peaks at 391 ºC and 391 ºC. This compound synthesized in buffered pH of 8.0, with the molecular formula of Zn25L.28.5H2O, had its thermal decomposition in four steps of mass loss with an endothermic peak at 160 ºC.
The interpretation of each thermal event in these curves is shown in Table 2.
The dehydration are related to the elimination of hydration water, decomposition and oxidative degradation are observed in Table 2. The dehydroxylation/thermal decomposition and oxidative burn are related to the organic matter in TA.
4.3. Quantitative Analysis of the Antioxidant Activity
4.3.1. TA-Cu (II) and TA-Zn (II) Solubility
Although the tests had as the priority the solvents that are compatibles with TA and DPPH, the synthesized compounds were only partially soluble in the used solvents. Thereby the A2 and A4 compounds were partially soluble in ethyl acetate; A3, A5 and A8 in ethanol and A1, A6 and A7 in methanol.
4.3.2. Analytical Curve of DPPH
The analytical curves equations obtained from DPPH analysis were y = 0.0113x – 0.0063, with a correlation coefficient of r2 = 0.9993, in ethyl acetate solution; y = 0.0102x – 0.0019, with a correlation coefficient of r2 = 0.9988, in ethanolic solution; and y = 0.0144x – 0.0562, with a correlation coefficient of r2 = 0.9949, in methanolic solution. In the DPPH curve axis x is the DPPH concentration and axis y is the absorbance in the wavelength of 515 and 517 nm.
4.3.3. Antioxidant Activity of the Synthesized Compounds
A lower percentage of DPPHREM was observed in the experiment using ethyl acetate as solvent. This behavior was significant in all used concentrations. In ethanol, this percentage were about 3% (m/v) in 0.16 g L-1 and in methanol, with same concentration the percentage were about 7% (m/v). Values related to the kinetics of the reminiscent DPPH were observed. This behavior was observed in compounds that have good antioxidant activity. Fig. (5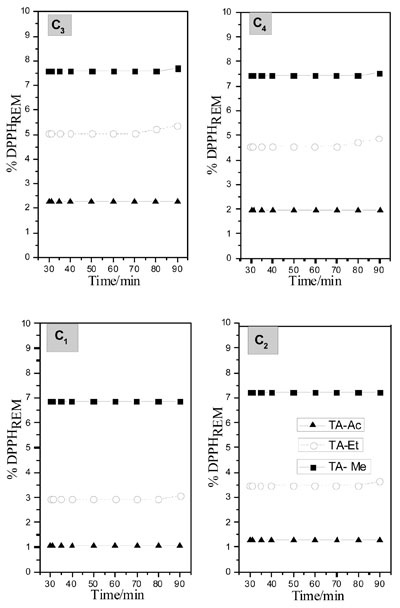 ) shows the percentage of DPPHREM of TA for the used solvents.
Fig. (6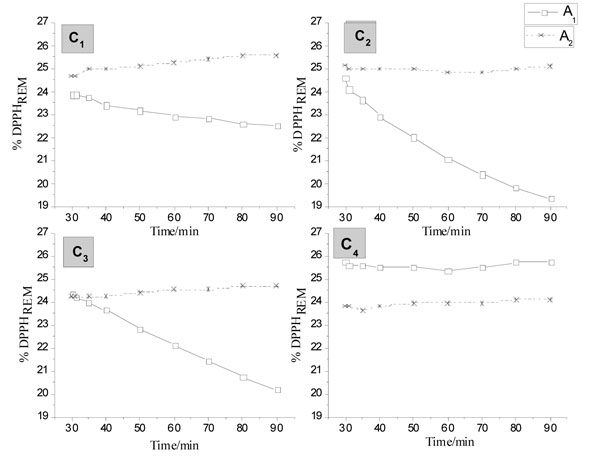 ) shows the kinetic behavior of TA-Cu(II) for A1 and A2 compounds, which are representative of all compounds. The A1 compound shows a lower concentration of DPPHREM, except for 0.04 g L-1 (C4). In concentrations of 0.12 (C2) and 0.08 (C3), it was observed a significant decrease in the concentration over time. In all used concentrations in the A2 compound, were observed an increase in the concentration of DPPHREM after 70 to 80 minutes of analysis.


A3 and A4 compounds have shown concentrations of DPPHREM lower than 25% over 30 minutes. However, the A4 compound showed a %DPPHREM, over time, lower than A3 in all concentrations except in 0.04 g L-1 (C4) where it had an interception after 70 minutes. Therefore, we can suggest that the A4 compound under the concentration of C1 has higher antioxidant activity in comparison with the other compounds in the same pH, due to a lower DPPHREM percentage over time.
The TA-Zn (II) compounds in 5.5 buffered pH have shown better antioxidant behavior in comparison with the other studied tannates. This indication can be observed in Fig. (7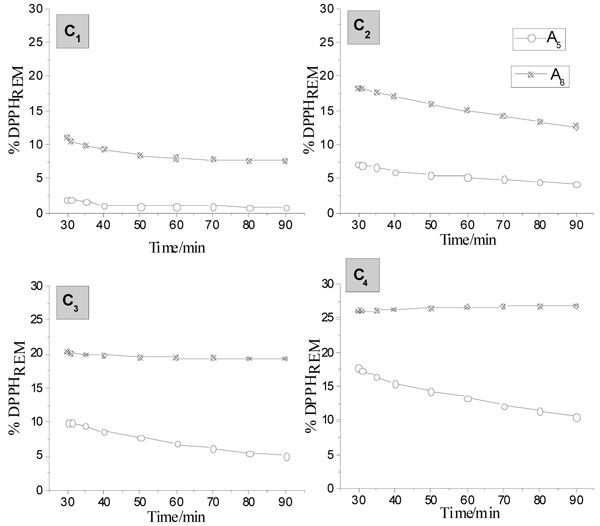 ). The 1:1 proportion (A5) presented the lowest percentage values of DPPHREM for all studied concentrations, yet in 0.16g L-1 concentration (C1), it showed less than 2.5% of DPPH.

In TA-Zn(II) compounds, the values related to the kinetic of DPPH reaction in pH 8 has shown a higher percentage of DPPH, under the proportion of 1:1, after 30 minutes of analysis. However, it was observed a decrease over time. This behavior suggests instability in A7 as well as in the proportion of 1:5 (A8).
The antioxidant percentage (%AA) of TA and its metallic compounds were studied and compared. The results are shown in Table 3.
Initially, the reaction of TA with DPPH shows a high percentage of antioxidant activity (%AA), being more apparent in ethyl acetate medium (99.35-94.15%).
The coordination between TA and the Copper ions decreased the antioxidant activity in comparison with free TA. It was observed a high activity in A4 compound which presented 60% in 30 minutes. Over time the antioxidant activity tends to increase, as shown in Table 4.
The zinc compound in buffered pH of 5.5 has shown a high percentage of antioxidant activity (%AA), but in pH 8 this percentage was negligible. An increase of the antioxidant activity (%AA) over time was observed for this compound too.
It was observed that the coordination between TA and Cu (II) and Zn (II) metallic ions decrease the antioxidant activity of the TA molecule. This reductive inefficiency of DPPH is due to the coordination of the metal ions with the hydroxyl groups of TA, which are the main responsible for the antioxidant effect [16Maqsood, S.; Benjakul, S. Synergistic effect of tannic acid and modified atmospheric packaging on the prevention of lipid oxidation and quality losses of refrigerated striped catfish slices. Food Chem., 2010, 121, 29-38.
[http://dx.doi.org/10.1016/j.foodchem.2009.11.086] ].
The coordination between copper and zinc in TA reduces the number of the available hydrogen donors, due to the complexation, which consequently turns this mechanism unavailable and decreases the antioxidant activity of the TA in comparison with the uncomplexed molecule.
CONCLUSION
The pH influence very much in the coordination between TA and a metal ion (Cu (II) and Zn (II)). The thermal analysis, spectroscopic studies, and the antioxidant evaluation indicated the coordination between the metal ions with TA and had shown unreported data about the dehydration, thermal stability, thermal decomposition, as well as residues formation.
The experiments indicate that the metal ions in solution contribute to the reduction of the antioxidant activity as the antioxidant effect over the DPPH radicals occurs due to their capacity of donating hydrogen. The characterization of the synthesized compounds proves them as pro-oxidant agents.
CONSENT FOR PUBLICATION
Not applicable.
CONFLICT OF INTEREST
The authors declare no conflict of interest, financial or otherwise.
ACKNOWLEDGEMENTS
The authors thank FAPEMAT, CNPq and the CAPES Foundations for financial support.
REFERENCES
| [1] | Birben, E.; Sahiner, U.M.; Sackesen, C.; Erzurum, S.; Kalayci, O. Oxidative Stress and Antioxidant Defense. World Allergy Organ. J., 2012, 5, 9-19. [http://dx.doi.org/10.1097/WOX.0b013e3182439613] |
| [2] | Elmasry, S.A.; Al-Azzawi, M.A.; Ghoneim, A.H.; Nasr, M.Y.; AboZaid, M.M.N. Role of oxidant–antioxidant imbalance in the pathogenesis of chronic obstructive pulmonary disease. Egypt. J. Chest Dis. Tuberc., 2015, 64, 813-820. [http://dx.doi.org/10.1016/j.ejcdt.2015.06.001] |
| [3] | Sungur, S.; Uzar, A. Investigation of complexes tannic acid and myricetin with Fe(III). Spectrochim. Acta A Mol. Biomol. Spectrosc., 2008, 69(1), 225-229. [http://dx.doi.org/10.1016/j.saa.2007.03.038] [PMID: 17493867] |
| [4] | Choi, J.M.; Han, J.; Yoon, B. Antioxidant properties of tannic acid and its inhibitory effects on paraquat induced oxidative stress in mice. Food Sci. Biotechnol., 2006, 15, 728-734. |
| [5] | Khan, N.S.; Ahmad, A.; Hadi, S.M.; Khan, N.S. Anti-oxidant, pro-oxidant properties of tannic acid and its binding to DNA. Chem. Biol. Interact., 2000, 125(3), 177-189. [http://dx.doi.org/10.1016/S0009-2797(00)00143-5] [PMID: 10731518] |
| [6] | Fu, L.; Liu, F.; Ma, Y.; Tao, X.; Ling, C.; Li, A.; Shuang, C.; Li, Y. High-efficient technique to simultaneous removal of Cu(II), Ni(II) and tannic acid with magnetic resins: Complex mechanism behind integrative application. Chem. Eng. J., 2015, 263, 83-91. [http://dx.doi.org/10.1016/j.cej.2014.11.041] |
| [7] | Kraal, P.; Jansen, B.; Nierop, K.G.J.; Verstraten, J.M. Copper complexation by tannic acid in aqueous solution. Chemosphere, 2006, 65(11), 2193-2198. [http://dx.doi.org/10.1016/j.chemosphere.2006.05.058] [PMID: 16837024] |
| [8] | Cruz, B.H.; Díaz-Cruz, J.M.; Ariño, C.; Esteban, M. Heavy metal binding by tannic acid: A voltammetric study. Electroanalysis, 2000, 12, 1130-1137. [http://dx.doi.org/10.1002/1521-4109(200010)12:14<1130::AID-ELAN1130>3.0.CO;2-7] |
| [9] | Chakrabarty, T.; Pérez-Manríquez, L.; Neelakanda, P.; Peinemann, K.V. Bioinspired tannic acid-copper complexes as selective coating for nanofiltration membranes. Separ. Purif. Tech., 2017, 184, 188-194. [http://dx.doi.org/10.1016/j.seppur.2017.04.043] |
| [10] | Çakar, S.; Özacar, M. Fe-tannic acid complex dye as photosensitizer for different morphological ZnO based DSSCs, Spectrochim. Acta - Part A Mol. Biomol. Spectrosc., 2016, 163, 79-88. [http://dx.doi.org/10.1016/j.saa.2016.03.031] [PMID: 27043871] |
| [11] | Brito, C.C.S.M.; Cardoso, A.P.; Caires, F.J.; Siqueira, A.B. Characterization and thermal behavior of tannic acid compounds with Fe(II) and Co(II) in solid state. Brazilian J. Therm. Anal., 2015, 4, 6. [http://dx.doi.org/10.18362/bjta.v4.i1-2.60] |
| [12a] | Brito, C.C.S.M.; Oliveira, R.B.M.; de Campos, F.X.; de Paula, A.C.; Soares, M.R.S.; Terezo, A.J.; Siqueira, A.B. Characterization and thermal behavior of tannic acid compounds with Zn(II) and Ni(II) in the solid state. Brazilian J. Therm. Anal., 2012, 01, 8-14. |
| [12b] | Brand-Williams, W.; Cuvelier, M.E.; Berset, C. Use of a free radical method to evaluate antioxidant activity. Lebensm. Wiss. Technol., 1995, 28, 25-30. [http://dx.doi.org/10.1016/S0023-6438(95)80008-5] |
| [13a] | Tondi, G.; Oo, C.W.; Pizzi, A.; Trosa, A.; Thevenon, M.F. Metal adsorption of tannin-based rigid foams. Ind. Crops Prod., 2009, 29, 336-340. [http://dx.doi.org/10.1016/j.indcrop.2008.06.006] |
| [13b] | Sousa, C.M.D.M.; Silva, H.R.E.; Vieira, G.M.; Ayres, M.C.C.; Da Costa, C.L.S.; Araújo, D.S.; Cavalcante, L.C.D.; Barros, E.D.S.; Araújo, P.B.D.M.; Brandão, M.S.; Chaves, M.H. Fenóis totais e atividade antioxidante de cinco plantas medicinais. Quim. Nova, 2007, 30, 351-355. [http://dx.doi.org/10.1590/S0100-40422007000200021] |
| [14] | Wu, S.J.; Ho, Y-C; Jiang, S.Z.; Mi, F.L. Effect of tannic acid–fish scale gelatin hydrolysate hybrid nanoparticles on intestinal barrier function and α-amylase activity. Food Funct., 2015, 6, 2283-2292. [http://dx.doi.org/10.1039/c4fo01015a] |
| [15] | Moreira, D.D.L.; Leitão, S.G.; Gonçalves, J.L.S.; Wigg, M.D.; Leitão, G.G. Antioxidant and antiviral properties of Pseudopiptadenia contorta (Leguminosae) and of quebracho (Schinopsis sp.) extracts. Quim. Nova, 2005, 28, 421-425. [http://dx.doi.org/10.1590/S0100-40422005000300011] |
| [16] | Maqsood, S.; Benjakul, S. Synergistic effect of tannic acid and modified atmospheric packaging on the prevention of lipid oxidation and quality losses of refrigerated striped catfish slices. Food Chem., 2010, 121, 29-38. [http://dx.doi.org/10.1016/j.foodchem.2009.11.086] |