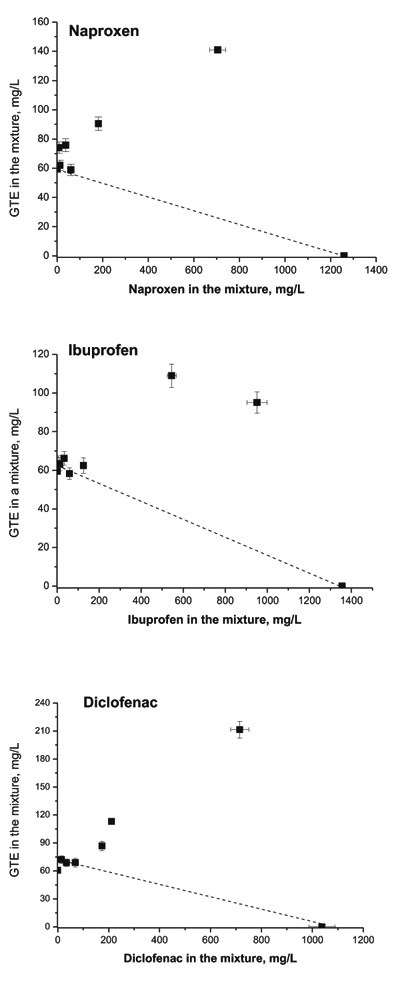
Fig. (3)
Isobolograms for green tea polyphenols and pharmaceuticals in the DPPH assay. The EC50 values for a given pharmaceutical and GTE are placed on the graph, on X- and Y-axes, respectively. The isoboles of additivity are shown as dashed lines drawn between the appropriate EC50 values. The solid points depict the experimental EC50 values of the mixtures for their fixed-ratio combination.