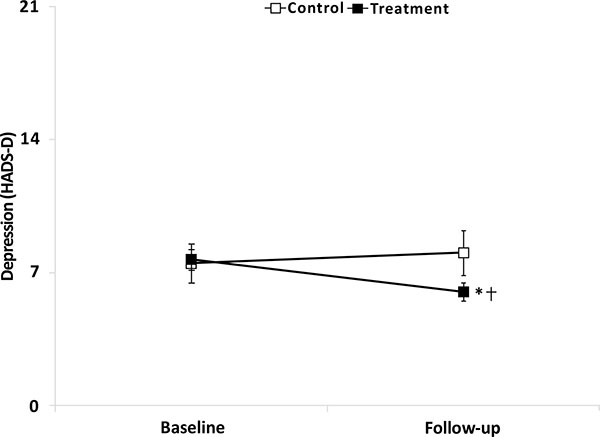
Fig. (2) Mean (±SEM) depression score (HADS-D) in the treatment group (filled squares, n=50) and the control group (open squares, n=20) at baseline and follow-up. Significantly different compared with baseline (*, NK: P < 0.05) and significantly different compared with control group (†, NK: P < 0.05).