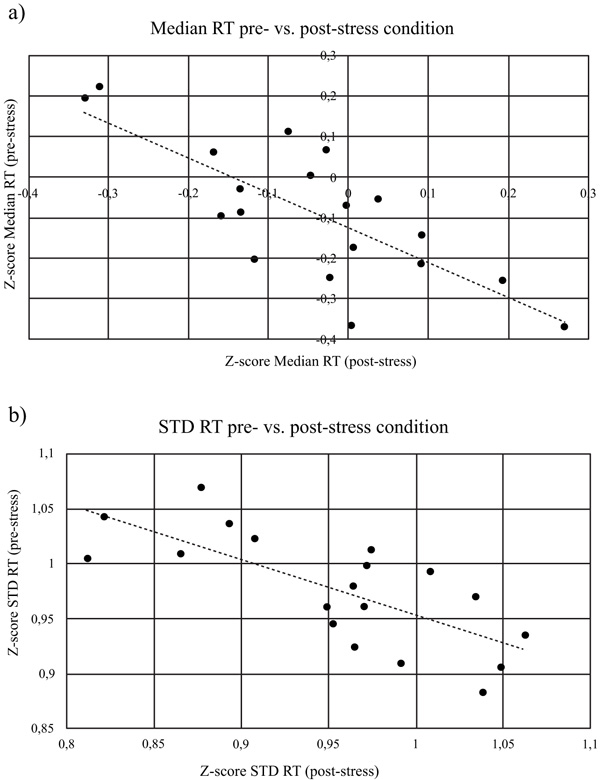
Fig. (4)
RT-related measures evolution between pre- and post-stress conditions. (a) Graphic representing the relation between z-score Median RT pre- (CRTT1) and post-stress (CRTT2) conditions and corresponding fit line. (b) Z-score standard deviation values (SD) of RT relation between pre- and post-stress stages and fit line.