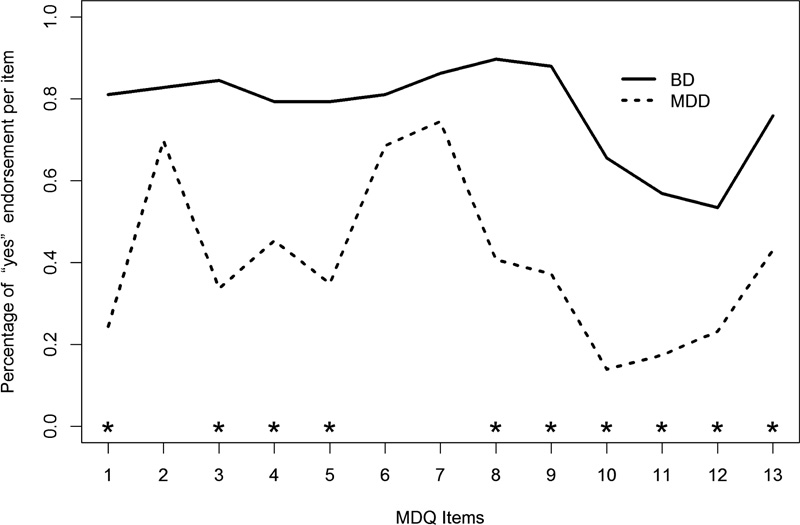
Fig. (1)
Profile plot of the distribution of the MDQ items’ scores by diagnosis. On the vertical axis (y-axis) it is reported the percentage of ‘yes’ endorsement of the item by diagnosis; on the horizontal axis (x-axis) there are the 13 items of the MDQ. Items for which a statistically significant difference at p<0.0001 was found on the Mann-Whitney U test were marked with an asterisk.