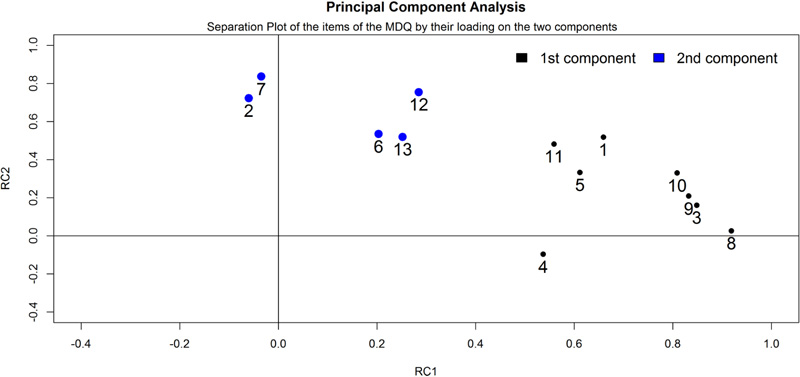
Fig. (3)
Separation plot of the results of the principal component analysis applied to the items of the Mood Disorder Questionnaire (n = 13). Items are plotted on the basis of their loadings on the two extracted main dimensions. An item is as much “separated” along the two dimensions as much its loading differs across the two dimensions, i.e., it is very high on one dimension and very low on the other dimension.