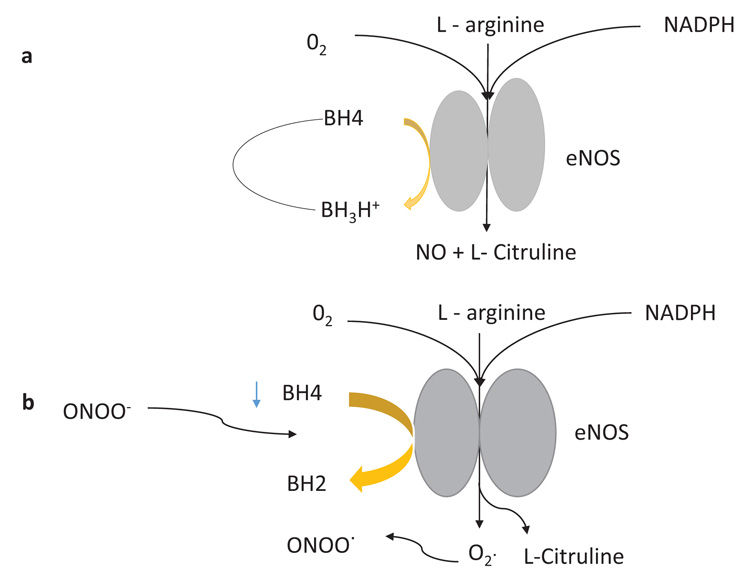
Fig. (7)
Diagrammatic representation of reactive oxygen species generation through eNOS uncoupling by step
a
and step
b
[7].