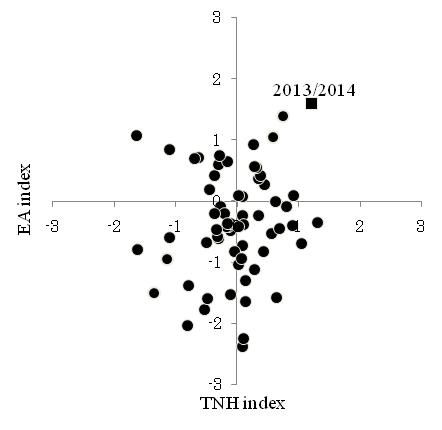
Fig. (2)
Scatterplot of the EA index
versus
the TNH index during the period from 1951 to 2014. A black square is winter 2013/14.