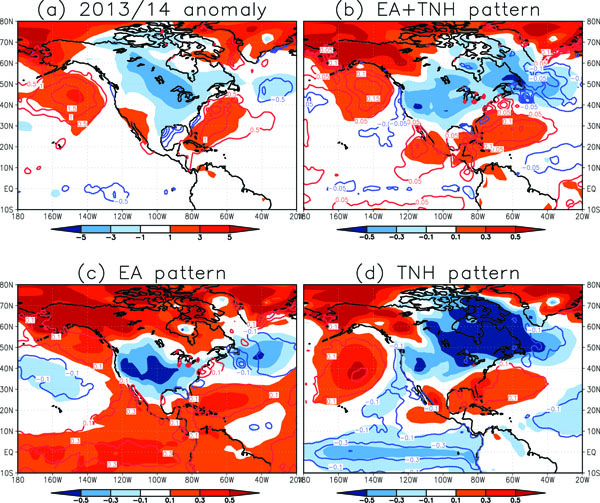
Fig. (6) (a) T2m (C°, colors) and SST (C°, contours) anomalies during winter 2013/14. Anomalies are calculated relative to the mean from 1981 to 2010. (b) Regression pattern of the T2m and SST regressed on the EA+TNH index. (c) As in Fig. (6b) but regressed on the EA index. (d) As in Fig. (6b) but regressed on the TNH index.