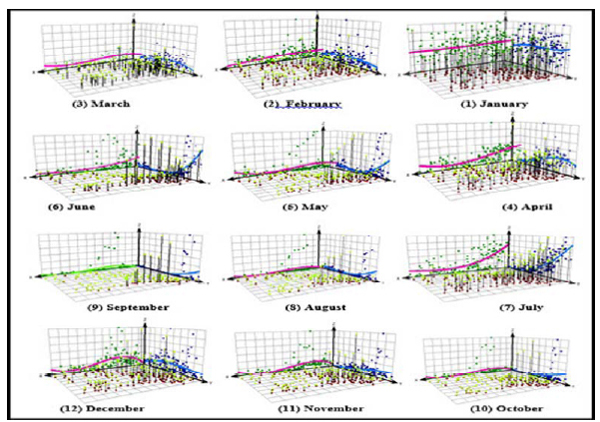
Fig. (6) Trend analyses of monthly precipitation data of January (1) to December (12) by three dimensional plots of the dataset from 140 climate stations over Iran. Monthly precipitation values are projected onto the x-z (west) and y-z (north) planes of the scatter plots, respectively.