- Home
- About Journals
-
Information for Authors/ReviewersEditorial Policies
Publication Fee
Publication Cycle - Process Flowchart
Online Manuscript Submission and Tracking System
Publishing Ethics and Rectitude
Authorship
Author Benefits
Reviewer Guidelines
Guest Editor Guidelines
Peer Review Workflow
Quick Track Option
Copyediting Services
Bentham Open Membership
Bentham Open Advisory Board
Archiving Policies
Fabricating and Stating False Information
Post Publication Discussions and Corrections
Editorial Management
Advertise With Us
Funding Agencies
Rate List
Kudos
General FAQs
Special Fee Waivers and Discounts
- Contact
- Help
- About Us
- Search


The Open Atmospheric Science Journal
(Discontinued)
ISSN: 1874-2823 ― Volume 14, 2020
A Case Study of Municipal Solid Waste Landfills Impact on Air Pollution in South Areas of Italy
Marianna Conte1, *, Vincenzo Cagnazzo2, Antonio Donateo1, Daniela Cesari1, Fabio Massimo Grasso1, Daniele Contini1
Abstract
Methods:
Air samples were collected at three landfills for Municipal Solid Waste (MSW), located in South-Eastern Italy in Lecce province, during summer 2009. Measurements were focused on evaluation of concentrations of PM10, Polycyclic Aromatic Hydrocarbons (PAHs), Polychlorinated (PCDD/F and PCB), Volatile Organic Compounds (VOCs) and Benzene, Toluene, Xylene (BTXs).
Results:
The average PM10 concentrations observed at Burgesi and Nardò landfills were comparable with the average of the territory while PM10 at Cavallino landfill was higher than the typical average. The VOC concentrations showed the predominant occurrence of the limonene and alfa-pynene compounds at all sites. Maximum concentrations of limonene and alfa-pynene were observed at Cavallino landfill. The PCDD/F and PCB concentrations showed significant variabilities among the different sites. It was noted that the average concentrations of the PCDD/F were higher at Nardò landfill. No particular correlations were observed between PCDD/F and PAH concentrations and between PCB and PAH concentrations.
Conclusion:
These results can be explained considering that PAH, PCDD/F and PCB sources could be different. Another explanation can be that PCDD/Fs and the PCBs are mainly in the particulate fraction instead PAHs are mainly in the gas fraction. The average ratios of BTX concentrations associated to downwind and upwind sectors were significantly larger than 1 for the three gases and for the sites of Burgesi and Nardò. The relevant directionality of BTX concentrations indicates the presence of contributions to the landfills. At last, the toxicity of PAHs was considered evaluating the Equivalent Toxicity Factors (TEFs). The results show that the maximum value of the average BaP equivalent concentration was at Cavallino instead the values observed at Burgesi and Nardò sites were lower and comparable.
Article Information

Identifiers and Pagination:
Year: 2018Volume: 12
First Page: 1
Last Page: 13
Publisher Id: TOASCJ-12-1
DOI: 10.2174/1874282301812010001
Article History:
Received Date: 29/09/2017Revision Received Date: 21/02/2018
Acceptance Date: 11/03/2018
Electronic publication date: 21/03/2018
Collection year: 2018
open-access license: This is an open access article distributed under the terms of the Creative Commons Attribution 4.0 International Public License (CC-BY 4.0), a copy of which is available at: https://creativecommons.org/licenses/by/4.0/legalcode. This license permits unrestricted use, distribution, and reproduction in any medium, provided the original author and source are credited.
* Address correspondence to this author at the Istituto di Scienze dell’Atmosfera e del Clima, ISAC-CNR, Str. Prv. Lecce-Monteroni km 1.2, 73100 Lecce, Italy; Tel: +39-0832298825; Fax: +39-0832298716; E-mail: m.conte@isac.cnr.it
| Open Peer Review Details | |||
|---|---|---|---|
| Manuscript submitted on 29-09-2017 |
Original Manuscript | A Case Study of Municipal Solid Waste Landfills Impact on Air Pollution in South Areas of Italy | |
1. INTRODUCTION
The generation of large amounts of Municipal Solid Waste (MSW) is one of the most relevant concern of our everyday lives. The increase of urbanization and population together with high consumer demand are the causes of this rapid growth in Europe [1Bogner J, Pipatti R, Hashimoto S, et al. Mitigation of global greenhouse gas emissions from waste: Conclusions and strategies from the Intergovernmental Panel on Climate Change (IPCC) Fourth Assessment Report. Waste Manag Res 2008; 26(1): 11-32.
[http://dx.doi.org/10.1177/0734242X07088433] [PMID: 18338699] , 2Tchobanoglous G, Kreith F. Handbook of Solid Waste Management 2nd ed. 2002.]. Solid waste has a complex composition and it is often managed with difficulties by the local municipalities/governments. Improper treatment of the MSW can represent a major risk for the human health and the environment [3Gómez G, Meneses M, Ballinas L, Castells F. Seasonal characterization of municipal solid waste (MSW) in the city of Chihuahua, Mexico. Waste Manag 2009; 29(7): 2018-24.
[http://dx.doi.org/10.1016/j.wasman.2009.02.006] [PMID: 19303762] , 4Li ZS, Yang L, Qu XY, Sui YM. Municipal solid waste management in Beijing City. Waste Manag 2009; 29(9): 2596-9.
[http://dx.doi.org/10.1016/j.wasman.2009.03.018] [PMID: 19375298] ]. In the worldwide the MSW discarded currently is more than one billion metric tons and this value will grow to 2.2 billion by 2025 [5Hoornweg D, Bhada-Tata P. What a waste: Waste management around the world 2012.]. For these reasons, the European Union (EU) delivered laws and regulations for better waste management. The Directive 1999/31/EC on the waste landfill sets objectives for the reduction of biodegradable waste [6Official Journal L182, 1999 Council Directive 1999/31/EC of 26 April 1999 on the landfill of waste 1999; 16.7: 1-19.]; the 2006 Regulation on shipments of waste sets information and procedures for transboundary waste transport [7Official Journal L. Regulation (EC) No 1013/2006 of the European Parliament and of the Council of 14 June 2006 on shipments of waste 2006; 12.7: 1-98.]; the Directive 2008/98/EC [8Official Journal L. Directive 2008/98/EC of the European Parliament and of the Council of 19 November 2008 on waste and repealing certain Directives 2008; 22.11: 3-30.] sets disposal and recovery operations for waste, and properties making waste hazardous. The Directive 2011/92/EU fixes the assessments of the effects of certain public and private projects on the environment [9Official Journal L. Directive 2011/92/EU of the European Parliament and of the Council of 13 December 2011 on the assessment of the effects of certain public and private projects on the environment 2012; 28.1: 3-23.].
The most common impacts of MSW on atmosphere composition regard odorous emissions and releases of atmospheric pollutants. Gaseous emissions are typically constituted by a variety of Greenhouse Gases (GHGs), compounds of nitrogen, sulphur and Volatile Organic Compounds (VOCs) [10Eitzer BD. Emissions of volatile organic chemicals from municipal solid waste composting facilities. Environ Sci Technol 1995; 29(4): 896-902.
[http://dx.doi.org/10.1021/es00004a009] [PMID: 22176396] ]. The Intergovernmental Panel on Climate Change landfills estimates that landfills emit less than 5% of the global GHG emissions and about 9% of methane (CH4) released globally. These estimates, however, are uncertain and variable as waste management can be a net source or sink of GHGs [1Bogner J, Pipatti R, Hashimoto S, et al. Mitigation of global greenhouse gas emissions from waste: Conclusions and strategies from the Intergovernmental Panel on Climate Change (IPCC) Fourth Assessment Report. Waste Manag Res 2008; 26(1): 11-32.
[http://dx.doi.org/10.1177/0734242X07088433] [PMID: 18338699] , 11Parry M, Canziani O, Palutikof J, van der Linden P, Hanson C. In Climate Change Impacts, adaptation and vulnerability Contribution of working group II to the fourth assessment report of the intergovernmental panel on climate change, ed 2007; 976.]. In MSW landfills, VOCs represent less than 1% (by volume) of the total gas landfill emissions [12Schuetz C, Bogner J, Chanton J, Blake D, Morcet M, Kjeldsen P. Comparative oxidation and net emissions of methane and selected non-methane organic compounds in landfill cover soils. Environ Sci Technol 2003; 37(22): 5150-8.
[http://dx.doi.org/10.1021/es034016b] [PMID: 14655701] , 13Tassi F, Montegrossi G, Vaselli O, Liccioli C, Moretti S, Nisi B. Degradation of C2-C15 volatile organic compounds in a landfill cover soil. Sci Total Environ 2009; 407(15): 4513-25.
[http://dx.doi.org/10.1016/j.scitotenv.2009.04.022] [PMID: 19446310] ], furtherly these emissions are influenced by reactivity (formation and degradation) of VOCs [13Tassi F, Montegrossi G, Vaselli O, Liccioli C, Moretti S, Nisi B. Degradation of C2-C15 volatile organic compounds in a landfill cover soil. Sci Total Environ 2009; 407(15): 4513-25.
[http://dx.doi.org/10.1016/j.scitotenv.2009.04.022] [PMID: 19446310] , 14Chiriac R, De Araujos Morais J, Carre J, Bayard R, Chovelon JM, Gourdon R. Study of the VOC emissions from a municipal solid waste storage pilot-scale cell: Comparison with biogases from municipal waste landfill site. Waste Manag 2011; 31(11): 2294-301.
[http://dx.doi.org/10.1016/j.wasman.2011.06.009] [PMID: 21778044] ]. Actually, toluene concentration values are high in landfill emissions with levels up to 250 ppm [15Kim KH, Choi YJ, Jeon EC, Sunwoo Y. Characterization of malodorous sulphur compounds in landfill gas. Atmos Environ 2005; 39: 1103-12.
[http://dx.doi.org/10.1016/j.atmosenv.2004.09.083] ], 100 ppm [16De la Rosa DA, Velasco A, Rosas A, Volke-Sepùlveda T. Total gaseous mercury and volatile organic compounds measurements at five municipal solid waste disposal sites surrounding the Mexico City Metropolitan Area. Atmos Environ 2006; 40: 2079-88.
[http://dx.doi.org/10.1016/j.atmosenv.2005.11.055] ] and 40 ppm [17Shin HC, Park JW, Park K, Song HC. Removal characteristics of trace compounds of landfill gas by activated carbon adsorption. Environ Pollut 2002; 119(2): 227-36.
[http://dx.doi.org/10.1016/S0269-7491(01)00331-1] [PMID: 12152829] ].
Despite the landfills should cause a minimal impact on the environment, the recent evidence has indicated that landfill-generated gases represent a risk to human health and the environment. Monitoring these compounds represent the key to successful management landfills.
The main aim of this study was to characterize the concentrations of PM10, BTXs (Benzene, Toluene, Xylene), a wide range of VOCs and PAHs (Polycyclic Aromatic Hydrocarbon), PCDD/Fs (Polychlorinated) and PCBs (Polychlorinated biphenyls) in the ambient air of three landfills, never studied before, located nearby the city of Lecce (Italy) evaluating and discussing the toxicity of the Persistent Organic Pollutants (POPs) investigated. Section 2 describes the experimental sites (2.1), the sampling methods and strategies (2.2) and the methodologies used for chemical analyses (2.3). Section 3 is dedicated to discussion of results regarding PM10 concentrations (3.1), BTX and VOC concentrations (3.2), PAH concentrations (3.3), PCDD/F and PCB concentrations (3.4). Conclusions are drawn in Section 4.
2. EXPERIMENTAL SECTION
2.1. Sites Description
Measurements were carried out at three landfills of Municipal Solid Waste (MSW) in the surrounding the town of Lecce (South-East Italy). Measurements were performed, successively at the three sites, from 30 June to 30 September 2009. The experimental sites were located at the landfills of Ugento, Cavallino and Nardò, three hamlets in Lecce Province. Precisely, the experimental site called “Burgesi”, shown in Fig. (1a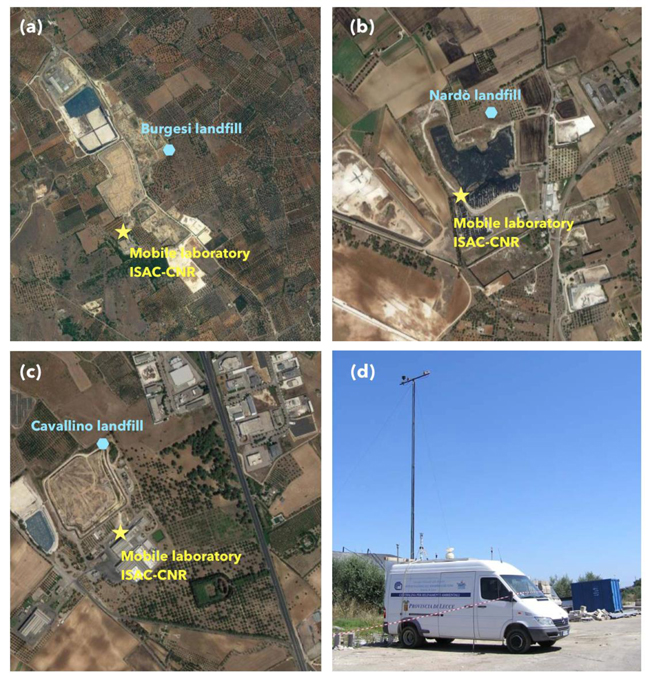 ), is located close to Ugento (39°53′09.16″N-18°11′10.18″E). The second site, shown in Fig. (1b), is located in Cavallino (40°17′05.44″N-18°02′30.46″E). The third site, shown in Fig. (1c) is located in Nardò (40°09′31.95″N-18°02′30.46″E).
2.2. Sampling Instruments and Methods
A mobile laboratory [18Contini D, Cesari D, Donateo A, Chirizzi D, Belosi F. Characterization Of PM10 and PM2.5 and their metals content in different typologies of sites in South-Eastern Italy. Atmosphere 2014; 5: 435-53.
[http://dx.doi.org/10.3390/atmos5020435] ] was used in this work. It was equipped with a low volume (2.3 m3/h) PM10 sampler (TCR-Tecora Delta) equipped with filters and Polyurethane Foam (PUF); an automatic analyser of benzene, toluene, xylenes (Syntech Spectras GC855) was used. A meteorological station, installed on a telescopic mast at 10 m above ground level. It was equipped with sensors to measure temperature and relative humidity (Campbell Scientific CS215), wind velocity and direction using a bi-dimensional sonic anemometer (WindSonic), precipitations using a rain gauge (Environmental Measurements ARG100). Meteorological data was acquired and processed in 30 minutes averages using a dedicated data-logger (Campbell Scientific CR200). An active sampling system on absorbent vials was used to collect samples dedicated to the determination of VOC concentrations. The mobile laboratory, shown in Fig. (1d), was positioned in the NW-NNE direction compared with the Burgesi landfill. At the Cavallino site, the laboratory was in the center of the complex with the landfill located between W and NNE direction, whereas the waste treatment plant was located in the S wind direction. At the Nardò site, the position of the laboratory was along the landfill access road, surrounded by the landfill in the wind sector direction between ENE and W.

The procedure for sampling PM10 was based upon active sampling using a low-volume (2.3 m3/h flow rate) air sampler. The atmospheric particles were collected on 47 mm glass fiber filters (Munktell, grade MGF) for 3 or 4 days to obtain a representative average concentration (for 72 h or 96 h depending on the analysed samples). The sampling volume was normalised at 25°C and 101.3 kPa. All filters were weighed before and after sampling using an analytical balance (Sartorious mod.CP2/F, reading precision 1 µg) after conditioning at a constant relative humidity for 48 hours. The experimental uncertainty was evaluated analysing the blank filters used for each experimental site [19Belosi F, Prodi F, Contini D, Donateo A. Measurements of atmospheric aerosol in the Salentum Peninsula and its correlation with local meteorology. Nuovo Cimento C 2006; 29: 473-86., 20Contini D, Donateo A, Cesari D, Belosi F, Francioso S. Identification and characterisation of local aerosol sources using high temporal resolution measurements. J Environ Monit 2010; 12(9): 1709-21.
[http://dx.doi.org/10.1039/c000642d] [PMID: 20559588] ]. The collected particle mass was calculated as the difference in weight of the filter before and after sampling subtracting the average field blank. The absolute uncertainty was evaluated by a combination of gravimetric uncertainty (2 standard deviation of blank filters) and sampling volume uncertainty (2%) and was fluctuated between 0.7 µg/m3 and 2.1 µg/m3 with an average value of 1.5 µg/m3.
A gas-chromatographer (Synthec Spectra GC855) was used to evaluate BTX (Benzene, Toluene, and Xilene) concentrations. The GC was able to furnish a required the zero and span check every 2-3 days with a standard gas mixture of known concentration of (Benzene, Toluene, m-Xylene, p-Xylene and o-Xylene). The sampling volume was normalised at 20°C and 101.3 kPa.
The evaluation of VOC concentrations was performed trough sorbent vials of activated carbon (Sorbent Tube HYGITEST charcoal jumbo sampling tube ST-01-03, 10-110 provided by TCR-Tecora) installed at the sites for 24 h-48 h with a flow rate of 1 L/min. The sampling volume was normalised at 20°C and 101.3kPa. After the collection, the vials were immediately sealed to minimize loss of VOCs [21Kolb B, Ettre LS. Static headspace-gas chromatography: theory and practice 2006.
[http://dx.doi.org/10.1002/0471914584] ] and transferred to the laboratory under 4 °C. The samples were analysed using a gas chromatography mass spectrometer [22Eichelberger J, Budde-Revision W, Munch J, Bellar-Revision T. Method 524.2 measurement of purgeable organic compounds in water by capillary column gas chromatography/mass spectrometry.Environmental monitoring systems laboratory office of research and development 1989; 45268.].
The sampling for the evaluation of organic micropollutants as PAHs, PCDDs, PCDFs, and PCBs, was conducted using PUF, coupled with the filters described above, through a sampler (Tecora Bravo H-Plus, flow rate 2.3 m3/h). The two types of PUF (Supelco and Tisch Environmental TE-1011) were treated with solvents before the sampling, to limit the uncertainty due to a possible contamination. Some non-exposed PUF and filters were analysed and used as blanks to subtract the background values and possible contaminations from measured concentrations.
2.3. Methodologies for Chemical Analysis
The chemical characterisations were performed at the Interuniversity Consortium “Chemistry for the Environment” (INCA, Lecce, Italy).
Analysis of VOCs at the three sites was performed by the combination of Mass Spectrometry (MS) and Gas Chromatography (GC). The electron ionization allows producing ions by the interaction of energetic electrons and gas phase molecules. The mass spectrometer is a linear quadrupole system so the ions are sorted according to their mass/charge (m/z) ratio and then detected by a detector. Mass spectra for each peaks in the total ion chromatogram were examined with respect to the fragmentation pattern of ions corresponding to various VOCs. This fragmentation pattern was compared with stored spectra in order to identify the compound. For each given compound, the intensity of the primary fragment was compared with the system response to the respective known compound to quantify its concentration [23McClenny WA, Holdren MW. 2009Analytical Method for the Determination of Volatile Organic Compounds (VOCs) in Air Collected in Canisters and Analyzed by Gas Chromatography/ Mass Spectrometry (GC/MS), Exhibit D, Chapter 1, Part 1A, Contract Laboratory Program 2009.]. VOCs were collected according to the standard method developed by NIOSH [24Method 2549 in the NIOSH Manual of Analytical Methods, fourth ed US Department of Health and Human Services, Center for Disease Control 1996.]. Standards of analysed VOCs were purchased from Sigma-Aldrich (Mississauga, Ont.). Acetone standard was purchased from VWR (France). The detection limit of each compound was estimated equal to 0.5 µg/m3.
The PAH extractions were performed by the Soxhlet technique using the vapour of dichloromethane-acetone 50:50 (v/v) solvent via the reflux cycle. The vapour passes through a bypass arm into the condenser, where it condenses and drips back onto the solvent in the PUF and filter. As the solvent reaches the top of the siphon arm, the solvent and the extract are siphoned back onto the lower flask whereby the solvent reboils, and the cycle is repeated until the whole sample is completely extracted into the lower flask. The extracts were further concentrated to dryness under nitrogen flux. Then a quantity of hexane was added. This aliquot was eluted on chromatographic columns that are able to separate the aliphatic hydrocarbon and PAHs using dichloromethane/hexane (1:1 mobile phase) [25Liu H, Zhang Q, Song M, Jiang G, Cai Z. Method development for the analysis of polybrominated diphenyl ethers, polychlorinated biphenyls, polychlorinated dibenzo-p-dioxins and dibenzo-furans in single extract of sediment samples. Talanta 2006; 70(1): 20-5.
[http://dx.doi.org/10.1016/j.talanta.2005.11.051] [PMID: 18970722] , 26USEPA. Tetra- through Octa-chlorinated dioxins and furans by isotope dilution HRGC/HRMS Method 1613 Revision B US Environmental Protection Agency 1994.]. The PAH fraction was concentrated and made up to a suitable volume in a vial to be analysed by a gas chromatograph and high resolution mass spectrometer. The quantification of PAHs were determined by specific standards [27Gonzalez A, Moilleron R, Chebbo G, Thévenot DR. Determination of Polycyclic Aromatic Hydrocarbons in urban runoff samples from the “LE MARAIS” experimental catchment in Paris centre. Polycycl Aromat Compd 2002; 20: 1-19.
[http://dx.doi.org/10.1080/10406630008034772] ]. The PAH Surrogate cocktail standard (ES-2044) was obtained from Cambridge Isotope Laboratories (CIL, Andover, MA, USA). PAH-Mix 3 (10 µg mL-1 in Isooctane) containing dibenzo(a,i)pyrene was purchased from Merck (Darmstadt, Germany). The other standards Dibenzo(a,l)pyrene, Dibenzo(a,e)pyrene and Dibenzo(a,h)pyrene (10 mg) were supplied by Dr. Ehrenstorfer GmbH (LGC). The detection limits for the different PAHs were estimated between 0.005 and 0.01 ng/m3. After the PAH analyses, joining the PAH fraction and the first fraction derived from the purification process through the chromatograph column, the separation of PCDD/Fs and PCBs was performed with an automated Power-Prep extraction system. The different fractions were separated using solvents (i.e. hexane, dichloromethane, acetone, toluene and specific column as silica, alumina and carbon) and then analysed [28Reiner EJ, Clement RE, Okey AB, Marvin CH. Advances in analytical techniques for polychlorinated dibenzo-p-dioxins, polychlorinated dibenzofurans and dioxin-like PCBs. Anal Bioanal Chem 2006; 386(4): 791-806.
[http://dx.doi.org/10.1007/s00216-006-0479-1] [PMID: 16794816] ]. Analyses were done using a GC-MS applying the methodologies US-EPA (Method 1613) and European Air Method (EN1948 2-4) for PCDD/Fs and the US-EPA (Method 1668A/B/C) for PCBs. The standard mixtures were prepared by appropriate dilution of commercially available stock solutions: Cerilliant Corporation and Wellington Laboratories for PCDD/Fs and CIL (Andover, MA, USA) for PCBs. The detection limits for PCDD/Fs were estimated between 0.005 and 0.05 fg-TE/m3, and 0.001 fg-TE/m3 for PCBs.
3. RESULTS AND DISCUSSION
3.1. PM10 Concentrations
Average PM10 concentrations at the three sites are compared in Fig. (2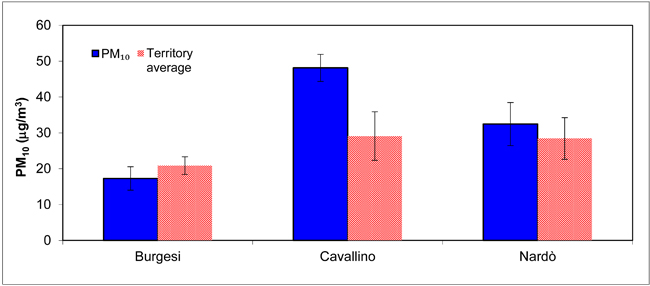 ). The wind roses of the different sampling periods at the three sites are reported in Fig. (3
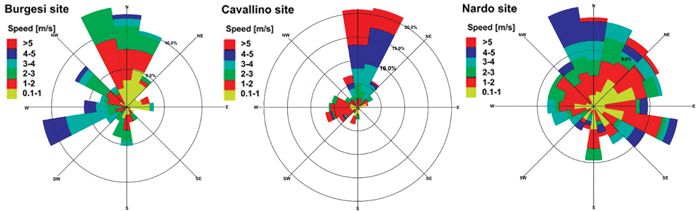 ). PM10 concentrations observed at the landfills were compared with the PM10 average values of the whole territory obtained by the network of air quality stations (Lecce, Arnesano, Campi, Galatina, and Surbo) managed by the Regional Environmental Authority (ARPA Puglia, www.arpa.puglia.it). The rain events were significant in the reference sampling period relatively at the first sample at Burgesi site and the second sample at Nardò site. The PM10 concentration observed at the sites of Burgesi and Nardò were comparable with the average of the territory during the same period; Instead, the PM10 concentration at Cavallino site showed a higher value with respect to the average of the territory, and closer to the daily threshold of 50 µg/m3. The last sample at Cavallino site showed a higher value (on the 4 day means) with respect to the PM10 daily threshold. The Italian normative (D.Lgs. n. 155 of the 13/08/10) allows 35 days per year above the average of 50 µg/m3. The third sample at Burgesi site showed a lower concentrations respect to the other sites. This value was associated with a South prevalent wind direction and were downwind respect to the surrounded zones. This underlined a possible contribution of the landfill to the PM10 concentrations. It was possible to observe that the PM10 concentration values of the Burgesi site were significant lower than those observed at Nardò and Cavallino sites. The maximum PM10 concentrations were observed at Cavallino site.

 |
Fig. (3) Wind roses relative to the different sample periods in the three experimental sites. |
3.2. BTX and VOC Concentrations
The measurements of Benzene, Toluene and Xylene (m-Xylene, p-Xylene, o-Xylene) were performed every 15 minutes using the automatic analyzer. The collected data were subjected to a validation based on the removal of the negative and null values, that were registered during the calibration of the instruments (on average every 2-3 days), on the analysis of the calibration stability and of the retention times. The gas pollutant concentrations were normalized at 20°C.
In Table 1 the average concentrations of Benzene, Toluene and total Xylene (sum of the m-Xylene, p-Xylene and o-Xylene) at the three measurement sites are compared. Concentrations of Benzene observed at the three sites were lower than the legislation thresholds (5 µg/m3, D.Lgs. n. 155 of the 13/08/2010). The territory average values of Benzene from the regional network for air quality monitoring during the period of the measurements at Burgesi site was 0.5 ± 0.1 µg/m3, at Cavallino site was 0.6 ± 0.2 µg/m3, and at Nardò site was 0.8 ± 0.3 µg/m3. This comparison shows (Table 2) that the values at Burgesi and Cavallino sites were comparable to the territory average, within the uncertainties, instead at Nardò site the concentrations were larger.
The hourly average concentrations of Benzene, Toluene and total Xylene were correlated with the hourly wind directions to investigate if there was an increase on concentrations when the measurements were done downwind of the landfills. The Burgesi site resulted downwind with respect to the landfill in the wind direction sector between 315° and 22.5°. The Nardò site resulted downwind with respect to the landfill in the wind direction sector between 292.5° and 225°. The mobile laboratory at Cavallino site was placed at the center of the landfill so in this case, it was not possible to establish specific upwind and downwind directions of the experimental site with respect to the landfill. The average ratios of concentrations associated to downwind and upwind sectors are reported in Fig. (4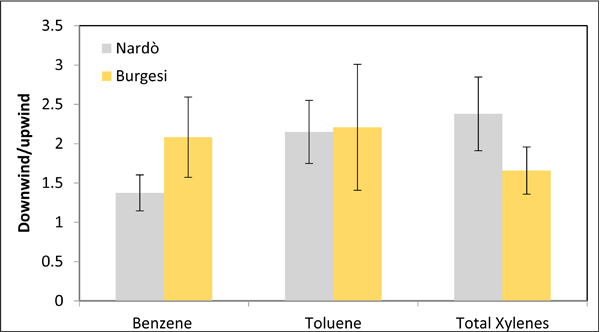 ). These ratios were significantly larger than one for the three gases and for both sites (Burgesi and Nardò) indicating that concentrations were larger, on average, downwind of the landfills. This relevant directionality of BTX concentrations suggest, likely, that landfills contribute to the locally measured concentrations of these gases.
 |
Fig. (4) Ratio between downwind and upwind values of BTX concentrations at Burgesi and Nardò sites. The vertical bars represent the standard errors on the ratios. |
The VOC average concentrations were obtained from the adsorbent vials and average concentrations are reported in Table 2. The “<” symbol indicates a value lower than the detection limit of the methodology used. Most of the compounds analyzed were below the detection limits except for limonene and alfa-pynene likely indicating that landfills contribute to these compounds.
3.3. PAH Concentrations
The average PAH concentrations and the relative standard deviations at the three landfills are reported in the Table 3. The concentration values were referred to the sum of PAHs present in gaseous and particulate phases. The table reports also the sum of different congeners analyzed (PAH_TOT).
Higher values were observed at Burgesi and Cavallino sites. It is known that the PAH concentrations in air have a seasonal pattern [29Yassaa N, Meklati BY, Cecinato A, Marino F. Organic aerosols in urban and waste landfill of Algiers metropolitan area: occurrence and sources. Environ Sci Technol 2001; 35(2): 306-11.
[http://dx.doi.org/10.1021/es991316d] [PMID: 11347602] , 30Gambaro A, Manodori L, Moret I, Capodaglio G, Cescon P. Transport of gas-phase polycyclic aromatic hydrocarbons to the Venice lagoon. Environ Sci Technol 2004; 38(20): 5357-64.
[http://dx.doi.org/10.1021/es049084s] [PMID: 15543737] ] and need long sampling period to be representative. The Table 3 shows a significant variability in the PAH concentrations of the different samples. This result is usually common for the territory of Lecce [31Amodio M, Caselli M, de Gennaro G, Tutino M. Particulate PAHs in two urban areas of Southern Italy: Impact of the sources, meteorological and background conditions on air quality. Environ Res 2009; 109(7): 812-20.
[http://dx.doi.org/10.1016/j.envres.2009.07.011] [PMID: 19700146] ]. In Yassa et al. [29Yassaa N, Meklati BY, Cecinato A, Marino F. Organic aerosols in urban and waste landfill of Algiers metropolitan area: occurrence and sources. Environ Sci Technol 2001; 35(2): 306-11.
[http://dx.doi.org/10.1021/es991316d] [PMID: 11347602] , 32Yassa N, Meklati BY, Cecinato A, Marino F. Particulate n-alkanes, n-alkanoic acids and polycyclic aromatic hydrocarbons in the atmosphere of Algiers City area. Atmos Environ 2001; 35: 1843-51.
[http://dx.doi.org/10.1016/S1352-2310(00)00514-8] ] was reported a comparison between the PAH concentrations in the urban area and close to a landfill of Algeri. The results showed that the higher PAH average concentrations were in PM10 concentration and close to the landfill. In Ladji et al. [33Ladji R, Yassaa N, Cecinato A, Meklati BY. Seasonal variation of particulate organic compounds in atmospheric PM10 in the biggest municipal waste landfill of Algeria. Atmos Res 2007; 86: 249-60.
[http://dx.doi.org/10.1016/j.atmosres.2007.06.002] ], the concentration of the total PAHs, close to the same landfill, were higher than 212 ng/m3 only in the PM10 fraction and the seasonal pattern was opposite with respect the typical patterns of the urban areas. The comparison between the average levels of total PAHs and BaP observed at the three experimental sites showed that the lower total PAH concentrations were observed at Burgesi landfill instead the higher at Cavallino site. It has to be mentioned that the Burgesi and Cavallino landfills gave a contribution to the emissions from the movement of vehicles in and close to the plants together with a contribution from traffic of the roads near the plants. The analysis of the Table 3 shows that the profile of PAH concentrations were different at the three landfills and the Benzo(a)anthracene and Chrysene had high concentrations at Cavallino and Nardò sites but were negligible at Burgesi site. The ratio between the fluoranthene and the sum of fluoranthene and pyrene varies from 0.53 (at Burgesi and Nardò landfills) to 0.9 at Cavallino landfill. The higher average concentrations of total PAHs and B(a)P were observed at Cavallino landfill in analogy with the previous results for limonene and alfa-pynene.
The toxicity of PAHs were evaluated using Toxic Equivalent Factors (TEFs), as done in Gregoris et al. [34Gregoris E, Argiriadis E, Vecchiato M, et al. Gas-particle distributions, sources and health effects of polycyclic aromatic hydrocarbons (PAHs), polychlorinated biphenyls (PCBs) and polychlorinated naphthalenes (PCNs) in Venice aerosols. Sci Total Environ 2014; 476-477: 393-405.
[http://dx.doi.org/10.1016/j.scitotenv.2014.01.036] [PMID: 24486495] ]. The equivalent concentrations for each PAH were calculated by multiplying the individual PAH concentration by its corresponding TEBaP value (Table 5), that ranges from 0.001 to 1 (for BaP and DahA) [34Gregoris E, Argiriadis E, Vecchiato M, et al. Gas-particle distributions, sources and health effects of polycyclic aromatic hydrocarbons (PAHs), polychlorinated biphenyls (PCBs) and polychlorinated naphthalenes (PCNs) in Venice aerosols. Sci Total Environ 2014; 476-477: 393-405.
[http://dx.doi.org/10.1016/j.scitotenv.2014.01.036] [PMID: 24486495] , 35Nisbet ICT, LaGoy PK. Toxic equivalency factors (TEFs) for polycyclic aromatic hydrocarbons (PAHs). Regul Toxicol Pharmacol 1992; 16(3): 290-300.
[http://dx.doi.org/10.1016/0273-2300(92)90009-X] [PMID: 1293646] ]. The TEBaP are reported in the Fig. (5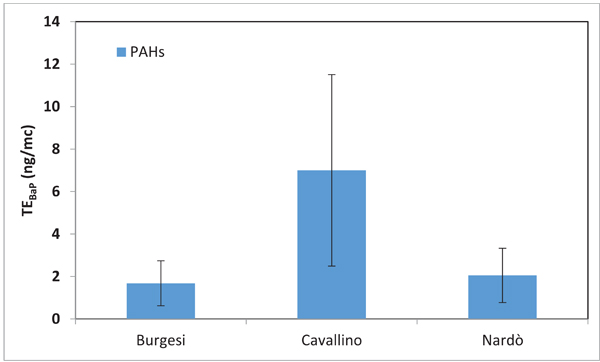 ) for each measurement site. The results show that the maximum average BaP equivalent concentration was at Cavallino with a value of 7.0 ± 4.5 ng/m3. The values observed at Burgesi and Nardò sites were lower and comparable: 1.7 ± 1.1 ng/m3 (Burgesi) and 2.0 ± 1.3 ng/m3 (Nardò). The values are higher than in other found in literature: in the Venice lagoon the average TEBaP value is 0.1 ng/m3 [34Gregoris E, Argiriadis E, Vecchiato M, et al. Gas-particle distributions, sources and health effects of polycyclic aromatic hydrocarbons (PAHs), polychlorinated biphenyls (PCBs) and polychlorinated naphthalenes (PCNs) in Venice aerosols. Sci Total Environ 2014; 476-477: 393-405.
[http://dx.doi.org/10.1016/j.scitotenv.2014.01.036] [PMID: 24486495] ], in the harbor area of Brindisi the value is 0.09 ng/m3 [36Donateo A, Gregoris E, Gambaro A, et al. Contribution of harbour activities and ship traffic to PM2.5, particle number concentrations and PAHs in a port city of the Mediterranean Sea (Italy). Environ Sci Pollut Res Int 2014; 21(15): 9415-29.
[http://dx.doi.org/10.1007/s11356-014-2849-0] [PMID: 24756672] ].
 |
Fig. (5) TE of the total PAHs at the three landfills. The vertical bars represent the standard errors. |
3.4. PCDD/F and PCB Concentrations
The PCDD/F and PCB concentrations are reported in the form of toxicity values. In this work, the equivalent toxicity level was evaluated according to the equivalent toxicity factors (I-TE) reported in Table 4 [37Van den Berg M, Birnbaum LS, Denison M, et al. The 2005 World Health Organization reevaluation of human and mammalian toxic equivalency factors for dioxins and dioxin-like compounds. Toxicol Sci 2006; 93(2): 223-41.
[http://dx.doi.org/10.1093/toxsci/kfl055] [PMID: 16829543] ]. The table includes the equivalent international toxicity factors for PCDD/F and the toxicity factors of PCB, defined as “dioxin-like” (PCBdl), according to the World Health Report [38WHO (World Health Organization). Health aspects of air pollution with particulate matter, ozone and nitrogen dioxide 2003 Jan 13–15. Report No.: EUR/03/5042688.].
The average equivalent concentrations of PCDD/F (Tetra-OctaCDD/F) and, PCB (Mono-DecaCB) are reported in Table 6. A summary of the total toxic equivalent concentrations for the three sites is reported in Fig. (6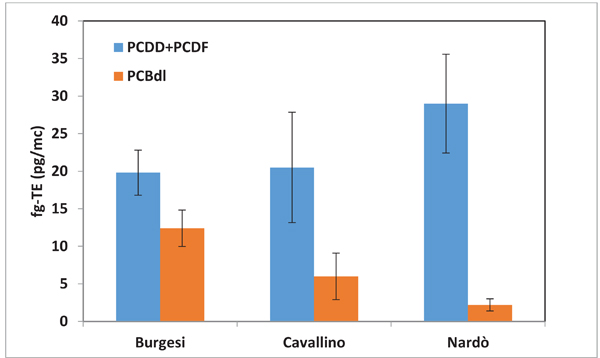 ). The mean level of PCDD/F, in each site, is relatively low and the maximum value of TE was observed at Nardò landfill. The values are comparable with other results obtained in Venice [34Gregoris E, Argiriadis E, Vecchiato M, et al. Gas-particle distributions, sources and health effects of polycyclic aromatic hydrocarbons (PAHs), polychlorinated biphenyls (PCBs) and polychlorinated naphthalenes (PCNs) in Venice aerosols. Sci Total Environ 2014; 476-477: 393-405.
[http://dx.doi.org/10.1016/j.scitotenv.2014.01.036] [PMID: 24486495] ] and in Europe [39Coutinho M, Ferreira J, Gomes P, Mata P, Borrego C. Atmospheric baseline levels of PCDD and PCDF in the region of Oporto. Chemosphere 2001; 43(4-7): 497-500.
[http://dx.doi.org/10.1016/S0045-6535(00)00400-8] [PMID: 11372832] -41Coutinho M, Pereira M, Borrego C. Monitoring of ambient air PCDD/F levels in Portugal. Chemosphere 2007; 67(9): 1715-21.
[http://dx.doi.org/10.1016/j.chemosphere.2006.05.084] [PMID: 17208281] ]. The mean level of PCBdl shows significant variability among the three landfills. The maximum variability and the higher average was observed at Burgesi landfill. This result is imputable at the concentration observed in the first sample.
 |
Fig. (6) Comparison between the mean levels of PCDD/F and PCBdl at the three experimental sites. The vertical bars represent the standard error. |
Comparing the TE values for PCDD at the three sites, it follows that 1,2,3,7,8- PeCDD was dominant at Burgesi. At Cavallino site the dominant compound is 2,3,7,8-TCDD instead at Nardò site the last mentioned compounds were comparable. For the TE of PCDF, the dominant compound was 2,3,4,7,8-PeCDF in all the measurement sites. For PCBdl, the dominant compound relatively to TE values was 3,3′,4,4′,5-PeCB(126) at Cavallino and Nardò sites and 2,3,4,4′,5-PeCB(114) at Burgesi site.
It is worth mentioning that the correlations between the concentration of PCDD/Fs and PAHs were rather limited. The same happens for the correlations of PCB and PAH concentrations. The possible reason is that the sources of PCDD/Fs and PCBs, and those of PAHs were different. Generally, PCDD/Fs and PCBs are mainly due to industrial emissions and the main sources in the region are the large industrial complexes of Brindisi and Taranto, located between 35 and 70 km from Lecce [42Regional Emission Inventory in Atmosphere of Apulia Region- IN. 2007. Available from: http://www.inemar.arpa.puglia.it]. Instead, road traffic and biomass burning could be a relevant source of PAHs [43Samburova V, Zielinska B, Khlystov A. Do 16 Polycyclic Aromatic Hydrocarbons Represent PAH Air Toxicity? Toxics 2017; 5(3): 17.
[http://dx.doi.org/10.3390/toxics5030017] [PMID: 29051449] ]. Another explanation could be that PCDD/Fs and PCBs are usually associated mainly to the aerosol phase, instead PAHs have usually a large gaseous component [34Gregoris E, Argiriadis E, Vecchiato M, et al. Gas-particle distributions, sources and health effects of polycyclic aromatic hydrocarbons (PAHs), polychlorinated biphenyls (PCBs) and polychlorinated naphthalenes (PCNs) in Venice aerosols. Sci Total Environ 2014; 476-477: 393-405.
[http://dx.doi.org/10.1016/j.scitotenv.2014.01.036] [PMID: 24486495] , 36Donateo A, Gregoris E, Gambaro A, et al. Contribution of harbour activities and ship traffic to PM2.5, particle number concentrations and PAHs in a port city of the Mediterranean Sea (Italy). Environ Sci Pollut Res Int 2014; 21(15): 9415-29.
[http://dx.doi.org/10.1007/s11356-014-2849-0] [PMID: 24756672] ].
CONCLUSION
PM10, VOCs, BTX, PAHs, PCDD/F and PCB concentrations ad toxicity levels were analyzed at three landfills (Burgesi, Cavallino, Nardò) in the province of Lecce (South-eastern Italy). The average PM10 concentration observed at Burgesi landfill were lower than those found in the Nardò landfill that were in turn lower than those observed in the Cavallino landfill. The average concentrations observed at Burgesi and Nardò landfills were comparable with the average of the territory instead were higher at Cavallino landfill.
Benzene concentrations were significantly lower than the normative level in each landfills but it was an indicative result because the time sampling was insufficient. The concentrations observed at the three landfills were comparable with the average of the territory with exclusion of Nardò site in which an higher concentration was observed. The analysis of the correlation between the concentrations of Benzene, Toluene and total Xylene and the wind directions underlined the contributions of the landfill emissions to BTX concentrations at Burgesi and Nardò sites.
VOCs concentrations showed the predominant occurrence of the limonene and alfa-pynene compounds and the presence of other compounds lower respect the detection limit. The higher concentrations of limonene and alfa-pynene were observed at Cavallino landfill.
PAH concentrations, sum of the particulate (PM10) and gas phases, were higher values were observed at Cavallino landfill. The concentration profiles of the PAHs were different at the three sites. This result can be explained by the presence of heavy equipment in the landfills and by the vehicular traffic on the streets close to the landfills (especially at Cavallino landfill).
PCDD/F and PCB concentrations showed significant variabilities among the different sample and the different sites. Relatively to the equivalent toxicity, 1,2,3,7,8-PeCDD was the dominant compound among PCDD at Burgesi landfill; the dominant compound at Cavallino landfill resulted 2,3,7,8-TCDD instead at Nardò landfill both the dioxins resulted comparable with the average value. Among PCDF the dominant compound in all the landfills was 2,3,4,7,8-PeCDF. Among PCBdl the dominant compounds were 3,3′,4,4′,5-PeCB(126), at Cavallino and Nardò landfills, and 2,3,4,4′,5-PeCB(114) at Burgesi landfill. The average PCBdl concentrations had significant variabilities among the three landfills and the maximum was observed at Burgesi landfill, instead, the concentrations observed at Nardò landfill were lower than the others. The correlation between PCDD/F and PAH concentrations were limited, the same for the correlation between the PCB and PAHs concentrations as a consequence of the different sources of PCDD/F, PCB, and PAH or by the different distributions in the gas and particulate phase.
CONSENT FOR PUBLICATION
Not applicable.
CONFLICT OF INTEREST
The authors declare no conflict of interest, financial or otherwise.
ACKNOWLEDGEMENTS
The financial contribution of the Province of Lecce is gratefully acknowledged. Authors wish to thank the managers of the landfills for hosting the instruments and for logistic support.
REFERENCES
| [1] | Bogner J, Pipatti R, Hashimoto S, et al. Mitigation of global greenhouse gas emissions from waste: Conclusions and strategies from the Intergovernmental Panel on Climate Change (IPCC) Fourth Assessment Report. Waste Manag Res 2008; 26(1): 11-32. [http://dx.doi.org/10.1177/0734242X07088433] [PMID: 18338699] |
| [2] | Tchobanoglous G, Kreith F. Handbook of Solid Waste Management 2nd ed. 2002. |
| [3] | Gómez G, Meneses M, Ballinas L, Castells F. Seasonal characterization of municipal solid waste (MSW) in the city of Chihuahua, Mexico. Waste Manag 2009; 29(7): 2018-24. [http://dx.doi.org/10.1016/j.wasman.2009.02.006] [PMID: 19303762] |
| [4] | Li ZS, Yang L, Qu XY, Sui YM. Municipal solid waste management in Beijing City. Waste Manag 2009; 29(9): 2596-9. [http://dx.doi.org/10.1016/j.wasman.2009.03.018] [PMID: 19375298] |
| [5] | Hoornweg D, Bhada-Tata P. What a waste: Waste management around the world 2012. |
| [6] | Official Journal L182, 1999 Council Directive 1999/31/EC of 26 April 1999 on the landfill of waste 1999; 16.7: 1-19. |
| [7] | Official Journal L. Regulation (EC) No 1013/2006 of the European Parliament and of the Council of 14 June 2006 on shipments of waste 2006; 12.7: 1-98. |
| [8] | Official Journal L. Directive 2008/98/EC of the European Parliament and of the Council of 19 November 2008 on waste and repealing certain Directives 2008; 22.11: 3-30. |
| [9] | Official Journal L. Directive 2011/92/EU of the European Parliament and of the Council of 13 December 2011 on the assessment of the effects of certain public and private projects on the environment 2012; 28.1: 3-23. |
| [10] | Eitzer BD. Emissions of volatile organic chemicals from municipal solid waste composting facilities. Environ Sci Technol 1995; 29(4): 896-902. [http://dx.doi.org/10.1021/es00004a009] [PMID: 22176396] |
| [11] | Parry M, Canziani O, Palutikof J, van der Linden P, Hanson C. In Climate Change Impacts, adaptation and vulnerability Contribution of working group II to the fourth assessment report of the intergovernmental panel on climate change, ed 2007; 976. |
| [12] | Schuetz C, Bogner J, Chanton J, Blake D, Morcet M, Kjeldsen P. Comparative oxidation and net emissions of methane and selected non-methane organic compounds in landfill cover soils. Environ Sci Technol 2003; 37(22): 5150-8. [http://dx.doi.org/10.1021/es034016b] [PMID: 14655701] |
| [13] | Tassi F, Montegrossi G, Vaselli O, Liccioli C, Moretti S, Nisi B. Degradation of C2-C15 volatile organic compounds in a landfill cover soil. Sci Total Environ 2009; 407(15): 4513-25. [http://dx.doi.org/10.1016/j.scitotenv.2009.04.022] [PMID: 19446310] |
| [14] | Chiriac R, De Araujos Morais J, Carre J, Bayard R, Chovelon JM, Gourdon R. Study of the VOC emissions from a municipal solid waste storage pilot-scale cell: Comparison with biogases from municipal waste landfill site. Waste Manag 2011; 31(11): 2294-301. [http://dx.doi.org/10.1016/j.wasman.2011.06.009] [PMID: 21778044] |
| [15] | Kim KH, Choi YJ, Jeon EC, Sunwoo Y. Characterization of malodorous sulphur compounds in landfill gas. Atmos Environ 2005; 39: 1103-12. [http://dx.doi.org/10.1016/j.atmosenv.2004.09.083] |
| [16] | De la Rosa DA, Velasco A, Rosas A, Volke-Sepùlveda T. Total gaseous mercury and volatile organic compounds measurements at five municipal solid waste disposal sites surrounding the Mexico City Metropolitan Area. Atmos Environ 2006; 40: 2079-88. [http://dx.doi.org/10.1016/j.atmosenv.2005.11.055] |
| [17] | Shin HC, Park JW, Park K, Song HC. Removal characteristics of trace compounds of landfill gas by activated carbon adsorption. Environ Pollut 2002; 119(2): 227-36. [http://dx.doi.org/10.1016/S0269-7491(01)00331-1] [PMID: 12152829] |
| [18] | Contini D, Cesari D, Donateo A, Chirizzi D, Belosi F. Characterization Of PM10 and PM2.5 and their metals content in different typologies of sites in South-Eastern Italy. Atmosphere 2014; 5: 435-53. [http://dx.doi.org/10.3390/atmos5020435] |
| [19] | Belosi F, Prodi F, Contini D, Donateo A. Measurements of atmospheric aerosol in the Salentum Peninsula and its correlation with local meteorology. Nuovo Cimento C 2006; 29: 473-86. |
| [20] | Contini D, Donateo A, Cesari D, Belosi F, Francioso S. Identification and characterisation of local aerosol sources using high temporal resolution measurements. J Environ Monit 2010; 12(9): 1709-21. [http://dx.doi.org/10.1039/c000642d] [PMID: 20559588] |
| [21] | Kolb B, Ettre LS. Static headspace-gas chromatography: theory and practice 2006. [http://dx.doi.org/10.1002/0471914584] |
| [22] | Eichelberger J, Budde-Revision W, Munch J, Bellar-Revision T. Method 524.2 measurement of purgeable organic compounds in water by capillary column gas chromatography/mass spectrometry.Environmental monitoring systems laboratory office of research and development 1989; 45268. |
| [23] | McClenny WA, Holdren MW. 2009Analytical Method for the Determination of Volatile Organic Compounds (VOCs) in Air Collected in Canisters and Analyzed by Gas Chromatography/ Mass Spectrometry (GC/MS), Exhibit D, Chapter 1, Part 1A, Contract Laboratory Program 2009. |
| [24] | Method 2549 in the NIOSH Manual of Analytical Methods, fourth ed US Department of Health and Human Services, Center for Disease Control 1996. |
| [25] | Liu H, Zhang Q, Song M, Jiang G, Cai Z. Method development for the analysis of polybrominated diphenyl ethers, polychlorinated biphenyls, polychlorinated dibenzo-p-dioxins and dibenzo-furans in single extract of sediment samples. Talanta 2006; 70(1): 20-5. [http://dx.doi.org/10.1016/j.talanta.2005.11.051] [PMID: 18970722] |
| [26] | USEPA. Tetra- through Octa-chlorinated dioxins and furans by isotope dilution HRGC/HRMS Method 1613 Revision B US Environmental Protection Agency 1994. |
| [27] | Gonzalez A, Moilleron R, Chebbo G, Thévenot DR. Determination of Polycyclic Aromatic Hydrocarbons in urban runoff samples from the “LE MARAIS” experimental catchment in Paris centre. Polycycl Aromat Compd 2002; 20: 1-19. [http://dx.doi.org/10.1080/10406630008034772] |
| [28] | Reiner EJ, Clement RE, Okey AB, Marvin CH. Advances in analytical techniques for polychlorinated dibenzo-p-dioxins, polychlorinated dibenzofurans and dioxin-like PCBs. Anal Bioanal Chem 2006; 386(4): 791-806. [http://dx.doi.org/10.1007/s00216-006-0479-1] [PMID: 16794816] |
| [29] | Yassaa N, Meklati BY, Cecinato A, Marino F. Organic aerosols in urban and waste landfill of Algiers metropolitan area: occurrence and sources. Environ Sci Technol 2001; 35(2): 306-11. [http://dx.doi.org/10.1021/es991316d] [PMID: 11347602] |
| [30] | Gambaro A, Manodori L, Moret I, Capodaglio G, Cescon P. Transport of gas-phase polycyclic aromatic hydrocarbons to the Venice lagoon. Environ Sci Technol 2004; 38(20): 5357-64. [http://dx.doi.org/10.1021/es049084s] [PMID: 15543737] |
| [31] | Amodio M, Caselli M, de Gennaro G, Tutino M. Particulate PAHs in two urban areas of Southern Italy: Impact of the sources, meteorological and background conditions on air quality. Environ Res 2009; 109(7): 812-20. [http://dx.doi.org/10.1016/j.envres.2009.07.011] [PMID: 19700146] |
| [32] | Yassa N, Meklati BY, Cecinato A, Marino F. Particulate n-alkanes, n-alkanoic acids and polycyclic aromatic hydrocarbons in the atmosphere of Algiers City area. Atmos Environ 2001; 35: 1843-51. [http://dx.doi.org/10.1016/S1352-2310(00)00514-8] |
| [33] | Ladji R, Yassaa N, Cecinato A, Meklati BY. Seasonal variation of particulate organic compounds in atmospheric PM10 in the biggest municipal waste landfill of Algeria. Atmos Res 2007; 86: 249-60. [http://dx.doi.org/10.1016/j.atmosres.2007.06.002] |
| [34] | Gregoris E, Argiriadis E, Vecchiato M, et al. Gas-particle distributions, sources and health effects of polycyclic aromatic hydrocarbons (PAHs), polychlorinated biphenyls (PCBs) and polychlorinated naphthalenes (PCNs) in Venice aerosols. Sci Total Environ 2014; 476-477: 393-405. [http://dx.doi.org/10.1016/j.scitotenv.2014.01.036] [PMID: 24486495] |
| [35] | Nisbet ICT, LaGoy PK. Toxic equivalency factors (TEFs) for polycyclic aromatic hydrocarbons (PAHs). Regul Toxicol Pharmacol 1992; 16(3): 290-300. [http://dx.doi.org/10.1016/0273-2300(92)90009-X] [PMID: 1293646] |
| [36] | Donateo A, Gregoris E, Gambaro A, et al. Contribution of harbour activities and ship traffic to PM2.5, particle number concentrations and PAHs in a port city of the Mediterranean Sea (Italy). Environ Sci Pollut Res Int 2014; 21(15): 9415-29. [http://dx.doi.org/10.1007/s11356-014-2849-0] [PMID: 24756672] |
| [37] | Van den Berg M, Birnbaum LS, Denison M, et al. The 2005 World Health Organization reevaluation of human and mammalian toxic equivalency factors for dioxins and dioxin-like compounds. Toxicol Sci 2006; 93(2): 223-41. [http://dx.doi.org/10.1093/toxsci/kfl055] [PMID: 16829543] |
| [38] | WHO (World Health Organization). Health aspects of air pollution with particulate matter, ozone and nitrogen dioxide 2003 Jan 13–15. Report No.: EUR/03/5042688. |
| [39] | Coutinho M, Ferreira J, Gomes P, Mata P, Borrego C. Atmospheric baseline levels of PCDD and PCDF in the region of Oporto. Chemosphere 2001; 43(4-7): 497-500. [http://dx.doi.org/10.1016/S0045-6535(00)00400-8] [PMID: 11372832] |
| [40] | Fiedler H. Sources of PCDD/PCDF and impact on the environment. Chemosphere 1996; 32(1): 55-64. [http://dx.doi.org/10.1016/0045-6535(95)00228-6] [PMID: 8564435] |
| [41] | Coutinho M, Pereira M, Borrego C. Monitoring of ambient air PCDD/F levels in Portugal. Chemosphere 2007; 67(9): 1715-21. [http://dx.doi.org/10.1016/j.chemosphere.2006.05.084] [PMID: 17208281] |
| [42] | Regional Emission Inventory in Atmosphere of Apulia Region- IN. 2007. Available from: http://www.inemar.arpa.puglia.it |
| [43] | Samburova V, Zielinska B, Khlystov A. Do 16 Polycyclic Aromatic Hydrocarbons Represent PAH Air Toxicity? Toxics 2017; 5(3): 17. [http://dx.doi.org/10.3390/toxics5030017] [PMID: 29051449] |