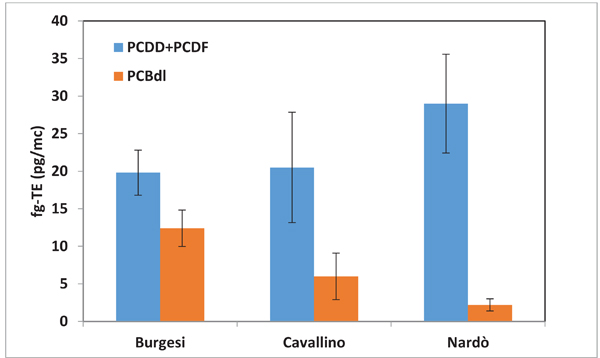
Fig. (6)
Comparison between the mean levels of PCDD/F and PCB
dl
at the three experimental sites. The vertical bars represent the standard error.