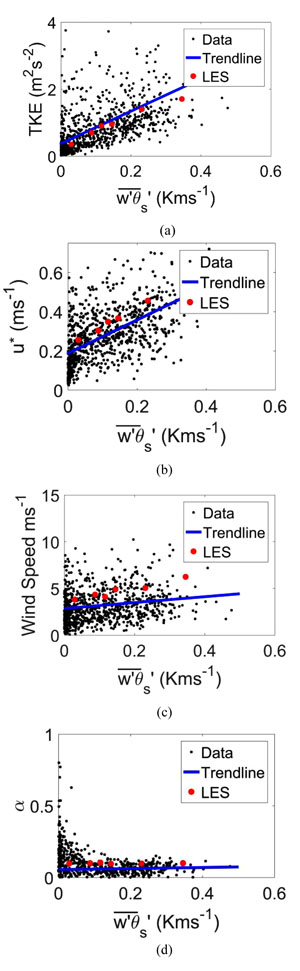
Fig. (7)
(a) Correlation for surface heat flux and TKE for the positive heat flux NREL July data with trendline and LES at 74 m. (b) Correlation for surface heat flux and friction velocity for the positive heat flux NREL July data with trendline and LES at 74 m. (c) Scatter plot for surface heat flux and wind speed for the positive heat flux NREL July data and LES at 74 m. (d) Scatter for surface heat flux and shear component for the positive heat flux NREL July data and LES at 10 and 86 m.