- Home
- About Journals
-
Information for Authors/ReviewersEditorial Policies
Publication Fee
Publication Cycle - Process Flowchart
Online Manuscript Submission and Tracking System
Publishing Ethics and Rectitude
Authorship
Author Benefits
Reviewer Guidelines
Guest Editor Guidelines
Peer Review Workflow
Quick Track Option
Copyediting Services
Bentham Open Membership
Bentham Open Advisory Board
Archiving Policies
Fabricating and Stating False Information
Post Publication Discussions and Corrections
Editorial Management
Advertise With Us
Funding Agencies
Rate List
Kudos
General FAQs
Special Fee Waivers and Discounts
- Contact
- Help
- About Us
- Search


The Open Atmospheric Science Journal
(Discontinued)
ISSN: 1874-2823 ― Volume 14, 2020
Analyzing the Fluctuations of Atmospheric Precipitable Water in Iran During Various Periods Based on the Retrieving Technique of NCEP/NCAR
Iman Rousta1, 2, *, Mehdi Doostkamian3, Haraldur Ólafsson4, Hao Zhang5, Sayed Hossein Vahedinejad6, Md Omar Sarif7, Edgar Ricardo Monroy Vargas8
Abstract
Introduction/ Methods:
The current study has compared the fluctuations of atmospheric precipitable water over Iran during three periods of 1948 – 1957, 1958 – 1978, and 1979 – 2012 using upper-air reanalyzed data from NCEP/NCAR.
Results:
The results indicated that, in all the three periods, average distribution and coefficient of spatial variation decreased with altitude. In contrast, there was a positive relationship between coefficient of spatial variation and altitude. The results of trend analysis showed that atmospheric precipitable water of Iran calculated using the upper-air reanalyzed data by NCEP/NCAR experienced various fluctuations during the three periods of 1948 – 1957, 1958 – 1978, and 1979 – 2012. The increase of the precipitable water during the first period was not significant at the level of 95%. The increase of the precipitable water during the second period was significant at the level of 95% just in 25% of the regions. In contrast to the second period, 70% of the country’s area followed a declining trend. However, this decreasing trend was not significant at the level of 95%, either.
Conclusion:
The results of Alexandersson statistical method showed that the biggest shift in the average of precipitable water happened during the third period. Overall, variations in the precipitable water over Iran in the past ~60 years are not within the uncertainty of the reanalysis data and are therefore clearly discernible.
Article Information

Identifiers and Pagination:
Year: 2018Volume: 12
First Page: 48
Last Page: 57
Publisher Id: TOASCJ-12-48
DOI: 10.2174/1874282301812010048
Article History:
Received Date: 12/12/2017Revision Received Date: 23/4/2018
Acceptance Date: 13/5/2018
Electronic publication date: 31/05/2018
Collection year: 2018
open-access license: This is an open access article distributed under the terms of the Creative Commons Attribution 4.0 International Public License (CC-BY 4.0), a copy of which is available at: https://creativecommons.org/licenses/by/4.0/legalcode. This license permits unrestricted use, distribution, and reproduction in any medium, provided the original author and source are credited.
* Address correspondence to this author at the Department of Geography, Yazd University, Yazd, Iran, Tel: +989171902098; E-mail: irousta@yazd.ac.ir
| Open Peer Review Details | |||
|---|---|---|---|
| Manuscript submitted on 12-12-2017 |
Original Manuscript | Analyzing the Fluctuations of Atmospheric Precipitable Water in Iran During Various Periods Based on the Retrieving Technique of NCEP/NCAR | |
1. INTRODUCTION
Iran is located in an arid and semiarid geographic area, with its average annual precipitation being equal to one-third of that on the global scale [1Masoudian SA. Climate of Iran 1 1st ed. 2011; 288.]. Because of the complex geographic position of Iran, climate varies from region to region [2Rousta I, Khosh A. F, Soltani M, Modir T. Sh S. Assessment of blocking effects on rainfall in northwestern Iran. COMECAP 2014; Heraklion-Grecce: COMECAP; 2014: 127-32.]. Variations are manifested as changes in the large-scale atmospheric and/or oceanic circulation patterns. These cause shifts in the temperature and precipitation Probability Distribution Functions (PDFs) [3Azizi G, Mohammadi H, Karimi M, Shamsipour AA, Rousta I. The relationship between the Arctic Oscillation and North Atlantic Blocking Frequency. Open J Atmos Clim Changes 2015.]. It is, therefore, necessary for policymakers and stakeholders in this country to manage rainwater resources. Studying fluctuations in precipitable water is a tool for water resource management. It helps scientists gain a better understanding of humidity changes. It should be noted that precipitation and precipitable water are two distinct concepts. Precipitation refers to any product of the condensation of atmospheric water vapor that falls on the ground. Therefore, it consists of condensation of fine water vapors in the atmosphere. Precipitable water, on the other hand, has to do with the depth of water in the column of atmosphere that can turn into fine liquid particles if the air temperature is lower than dew point temperature. The amount of precipitable water is expressed based on the altitude of water table [4Sadeghi HS, Hajam S, Tofangsaz P. A study of the relationship between precipitable water And observed precipitation over tehran. J The Earth Space Phys 2005; 31(2): 13-21.].
Changes in the frequency and intensity of climatic events are an indicator of climate change [5Rousta I, Doostkamian M, Haghighi E, Mirzakhani B. Statistical-synoptic analysis of the atmosphere thickness pattern of iran’s pervasive frosts. Climate (Basel) 2016; 4(3): 41.
[http://dx.doi.org/10.3390/cli4030041] -8Rousta I, Nasserzadeh M, Jalali M, et al. Decadal spatial-temporal variations in the spatial pattern of anomalies of extreme precipitation thresholds (Case Study: Northwest Iran). Atmosphere 2017; 8(8): 135.]. Precipitable water is an indicator of water vapor [9Gutman SI, Susan RS, Benjamin SG, et al. Rapid retrieval and assimilation of ground based GPS precipitable water observations at the NOAA Forecast Systems Laboratory: Impact on weather forecasts. J Meteorol Soc Japan Ser II 2004; 82(1B): 351-60.
[http://dx.doi.org/10.2151/jmsj.2004.351] , 10Mobasheri MR, Poorbager K SM, Farajzadeh A M, Sadeghi N A. Total precipitable water (TPW) assessment using MODIS images radiosonde data (Case study: Tehran District). Sci Res J Spat Plann 2010; 14(1): 107-26.]. Water vapor plays an important role in water and heat processes of the climate system [11Kassomenos P, McGregor G. The interannual variability and trend of precipitable water over southern Greece. J Hydrometeorol 2006; 7(2): 271-84.
[http://dx.doi.org/10.1175/JHM484.1] ]. Vapor is the main element of the hydrologic cycle and energy emissions to the atmosphere when it is condensed in the upper air. It is also the major resource of energy for global atmospheric circulation [12Bokoye A, Royer A, O’Neill N, et al. Multisensor analysis of integrated atmospheric water vapor over Canada and Alaska. J Geophys Res D Atmospheres 2003; 108(D15.)
[http://dx.doi.org/10.1029/2002JD002721] , 13Bony S, Duvel JP. Influence of the vertical structure of the atmosphere on the seasonal variation of precipitable water and greenhouse effect. J Geophys Res D Atmospheres 1994; 99(D6): 12963-80.
[http://dx.doi.org/10.1029/94JD00482] ]. As a result, vapor circulation plays a significant role in maintaining a balanced climate on the earth since it is the main source for equally spreading a considerable proportion of natural greenhouse gas effects across the world [14Shine K. Assessing the climate impact of trends in stratospheric water vapor. Geophys Res Lett 2002; 29(6)]. On the other hand, unlike other greenhouse gases, vapor varies a lot both in place and time, meaning that changes can be experienced both vertically and horizontally [15Marsden D, Valero FP. Observation of water vapor greenhouse absorption over the Gulf of Mexico using aircraft and satellite data. J Atmos Sci 2004; 61(6): 745-53.
[http://dx.doi.org/10.1175/1520-0469(2004)061<0745:OOWVGA>2.0.CO;2] ]. Precipitable water is an important meteorological parameter which has nowadays attracted the particular attention of cloud physicists [16Fallahe Ghalhari GA. Principles of Meteorology 1 ed. 1. 2011; 870.]. It is very crucial to investigate precipitable water, which is regarded as the main indicator for recognizing atmospheric instabilities [17Manzato A, Morgan G. Evaluating the sounding instability with the Lifted Parcel Theory. Atmos Res 2003; 67: 455-73.
[http://dx.doi.org/10.1016/S0169-8095(03)00059-0] ]. Some scientists use precipitable water to predict heavy precipitations [18Stout GE, Mueller EA. Survey of relationships between rainfall rate and radar reflectivity in the measurement of precipitation. J Appl Meteorol 1968; 7(3): 465-78.
[http://dx.doi.org/10.1175/1520-0450(1968)007<0465:SORBRR>2.0.CO;2] ] and changes in atmospheric humidity [19Hutchings J. Water-vapor transfer over the Australian Continent. J Meteorol 1961; 18(5): 615-34.
[http://dx.doi.org/10.1175/1520-0469(1961)018<0615:WVTOTA>2.0.CO;2] ].
An understanding of the atmospheric mechanism controlling extreme rainfall is necessary for assessing natural hazard risk and for developing strategies of mitigation and response to these extreme events [20Rousta I, Soltani M, Zhou W, Cheung HH. Analysis of extreme precipitation events over central plateau of iran. Am J Clim Change 2016; 5(03): 297.
[http://dx.doi.org/10.4236/ajcc.2016.53024] , 21Soltani M, Laux P, Kunstmann H, et al. Assessment of climate variations in temperature and precipitation extreme events over Iran. Theor Appl Climatol 2016; 126(3-4): 775-95.
[http://dx.doi.org/10.1007/s00704-015-1609-5] ]. The exact calculation of precipitable water requires detailed knowledge of water vapor in the atmosphere. The volume of atmosphere’s water vapor is also influenced by atmospheric compactness, temperature [22Adeyemi B. Empirical modeling of layered integrated water vapor using surface mixing ratio in Nigeria. J Appl Meteorol Climatol 2009; 48(2): 369-80.
[http://dx.doi.org/10.1175/2008JAMC1929.1] ] cloud coverage, direction and wind speed [23Karalis JD. Precipitable water and its relationship to surface dew point and vapor pressure in Athens. J Appl Meteorol 1974; 13(7): 760-6.
[http://dx.doi.org/10.1175/1520-0450(1974)013<0760:PWAIRT>2.0.CO;2] ], local factors and, most importantly, the wind and moisture convergence [16Fallahe Ghalhari GA. Principles of Meteorology 1 ed. 1. 2011; 870.]. Therefore, the amount of atmosphere’s moisture in high altitude atmosphere is reduced due to the increasing distance from the source of moisture, as well as reducing air temperature with altitude, thus reducing the capacity of the atmosphere of water vapor. Reduction of water vapor with altitude is more tangible at higher latitudes than low latitudes [24Parameswaran K, Murthy BVK. Altitude profiles of tropospheric water vapor at low latitudes. J Appl Meteorol 1990; 29(3): 665-79. 1990/08/01
[http://dx.doi.org/10.1175/1520-0450(1990)029<0665:APOTWV>2.0.CO;2] ]. Moisture content anywhere in the atmosphere comes from local evaporation and moisture displacement in horizontal and vertical positions. Therefore, more than 90 percent of atmospheric water vapor is limited to lower level of 850 hPa [25Peixóto JP, Oort AH, Street-Perrott A, Beran M, Ratcliffe R. Variations in the global water budget 1983; 5.
[http://dx.doi.org/10.1007/978-94-009-6954-4_2] ]. Also, Tuller (1968) has shown that the highest amount of precipitable water is in the summer season over the Bay of Bengal and the lowest values are in the winter at high latitudes and highlands [26Tuller SE. World distribution of mean monthly and annual precipitable water. Mon Weather Rev 1968; 96: 785-97.
[http://dx.doi.org/10.1175/1520-0493(1968)096<0785:WDOMMA>2.0.CO;2] ].
Knowing the content of precipitable water is a preventive measure in identifying heavy storms. Weather radars are efficient tools for monitoring weather systems. They reveal microphysical conditions of precipitation within clouds. Thus, in most parts of the world, precipitable water is measured by satellites and radars. Nevertheless, in the first period of reanalyzed upper-air data, weather radars did not cover vast areas, which forced scientists to measure precipitable water by analyzing data obtained through sending radiosonde [4Sadeghi HS, Hajam S, Tofangsaz P. A study of the relationship between precipitable water And observed precipitation over tehran. J The Earth Space Phys 2005; 31(2): 13-21.]. In addition to the abovementioned permanent ground and space weather stations, scientists sometimes establish temporary camps for a couple of months or even years in different parts of the earth. High-tech devises, such as airplanes and balloons, which are equipped with measuring tools or network probes, are used in these temporary camps for weather studies. These camps coordinate especially with space stations [27Harrison LP. On the water vapor in the atmosphere over the united states east of the rocky mountains. Mon Weather Rev 1931; 59(12): 449-72.
[http://dx.doi.org/10.1175/1520-0493(1931)59<449:OTWVIT>2.0.CO;2] ]. These temporary (though effective) investigations make it possible to probe into less known atmospheric mechanisms (e.g. the way clouds are formed and influenced by radiation) [28Humphreys W. The amount and vertical distribution of water vapor on clear days. Bull Mountain Wea Obs 1911; 4: 121-8.]. Thus, there is a global network of weather stations on the earth which can be used in specific times to simultaneously monitor atmospheric conditions and record temperature and pressure in various parts of the world for computer and non-computer analyses. Furthermore, the vertical structure of wind, temperature, and humidity can be analyzed through controlling radiation by weather balloons. Although this global network is useful and necessary, it does not cover all parts of the earth. There are few weather stations in under-developed countries. As a result, measurement tools play an important role in the accurate assessment of climate elements, especially precipitable water.
Therefore, the current study aimed at investigating fluctuations in atmospheric precipitable water of Iran during various periods of NCEP/NCAR upper-air reanalyzed data (1948 – 1957, 1958 – 1978, and 1979 – 2012). In fact, the purpose of the study is to study the probable fluctuations of the precipitated water in these three periods. For this purpose, rainfall spatial variability of the average of precipitable water and its trends over different periods NCEP/NCAR data was studied and analyzed.
2. DATA AND METHODS
The current study aimed at investigating fluctuations in atmospheric precipitable water of Iran during three periods of upper-air reanalyzed data (1948 – 1957, 1958 – 1978, and 1979 – 2012). To this end, pressure and specific humidity data for three periods of upper-air reanalyzed data were retrieved from NCEP/NCAR and analyzed [29Kalnay E, Kanamitsu M, Kistler R, et al. The NCEP/NCAR 40-Year reanalysis project. Bull Am Meteorol Soc 1996; 77(3): 437-71.]. This dataset has been established by the National Oceanic and Atmospheric Administration of the United States. This dataset has been developed in a three-state reanalysis with a spatial resolution of 2.5 ° 2.5° latitude by longitude and a 4-hour temporal resolution (00, 06, 12, and 18). The three stages are described below [30Masoodian SA, Asakereh H, Mohammadi B, Halabian AH. Display and proccesing of atmospheric data 1 ed. 1. 2011; 129.].
A: The first stage was accomplished in GARP (Global Atmosphere Research Program) Global Experiment (FGGE). In this stage, the observations from 1940 through the time when upper-air observations were established in 1957 (International Geophysical Year) were reanalyzed. During this period (1948 – 1957), upper-air data were scarce and had a three-hour time difference (UTC00:00,UTC00:06,UTC12:00,UTC18:00) with present observations (UTC00:03, UTC00:09, UTC15:00, UTC21:00). Moreover, the majority of recorded data belonged to the northern hemisphere. Thus, the reanalysis conducted in this decade is not as reliable as the ones carried out in other decades. Nonetheless, Climate Data Assimilation System (CDAS) is still implemented for available temporal data. Therefore, reanalyzed data are available from 1948.
B: This stage involves datasets ranging from 1958 to 1978. It was in this period that weather radar network was established. In this stage, in addition to field observations, ship-based observations, and radio speculations by balloons and airplanes, radar systems were used as surveillance systems. In this stage, the time of three-hour field observations changed. Despite the fact that few stations were equipped with radiosonde, the measurement accuracy of these tools enhanced. The reanalysis conducted since November 1957 (done in ERA-40 reanalysis) can be attributed to this period.
C: The third stage entailed establishing network dataset based on observations conducted since 1979. In this period, advanced satellites started to be used for measuring atmospheric variables. At the same time, data assimilation of the 15-year observation of ERA-15 reanalysis and 25-year observation of JRA-25 reanalysis was performed by the Japan Meteorological Agency.
The shortcomings of data reanalysis and assimilation lead to bias in estimations. On the other hand, some changes occurred in surveillance systems during the aforementioned three stages; therefore, reanalysis centers do not recommend linear trend estimation based on reanalysis. Although reanalysis has eliminated many shortcomings, there are still some false trends and shifts. Therefore, care must be exercised in finding trends and, in order to achieve reliable results, particular considerations should be taken into account [31Prakash S, Giri R. Adesh Precipitable Water vapour at santacruz airport mumbai from Radiosonde Measurements: A Study. Int J Phys Math Sci 2012; 2: 120-30.]. Thus, measurement tools have differed in various periods. As a result, in order to investigate the condition of precipitable water during the three periods of reanalyzed data, pressure and specific humidity data for the whole time (1948 – 2012) were retrieved from NCEP/NCAR (29). Programming features in Grads and Matlab [32Doty BE, Kinter JLI. Geophysical data analysis and visualization using the Grid Analysis and Display System. National Aeronautics and Space Administration, Washington, DC (United States), 1995 N--96-25512; NASA-SP--519;NAS--1.21:519;NIPS--96-08516; TRN: 9625535 United States TRN: 9625535 CASI HC A02/MF A03 STAR English., 33 MATLAB and Statistics Toolbox Release 2014a, inventorThe MathWorks, Inc. United States 2014.] were used for conducting calculations. Furthermore, Surfer was utilized for drawing diagrams. In order to calculate precipitable water in the territory of Iran (from 25° to 40° North and 42.5° to 65° East), programming features of Grads were used; that is, the integral weight of humidity was calculated in the vertical dimension between levels of 1000 and 275 hPa. Consequently, based on the features of the abovementioned software program, precipitable water was calculated based on kg/m2 (mm) between the earth and tropopause. At first, in order to calculate precipitable water, the following formula was used in Eq. (1) [13Bony S, Duvel JP. Influence of the vertical structure of the atmosphere on the seasonal variation of precipitable water and greenhouse effect. J Geophys Res D Atmospheres 1994; 99(D6): 12963-80.
[http://dx.doi.org/10.1029/94JD00482] , 16Fallahe Ghalhari GA. Principles of Meteorology 1 ed. 1. 2011; 870.]:
 |
(1) |
In this formula, pw refers to precipitable water, g stands for gravity, is the studied variable (here specific humidity in terms of g/kg), and dp refers to pressure. After retrieving precipitable water, regression analysis was used to conduct trend analysis. In this trend, the variation of precipitable water (y) during time (x) is investigated.
Then, in order to have a general picture of atmospheric precipitable water in Iran, mean score and spatial coefficient of variation were calculated for the three periods. Subsequently, in order to investigate temporal and spatial variations of upper-air precipitable water, regression analysis was carried out. Furthermore, in order to investigate fluctuations of precipitable water, Alexandersson statistical method was used. In this method, the mean score of k in the first year is compared with that of n-k in the subsequent year, which yields T(K) [34Alexandersson H, Moberg A. Homogenization of Swedish temperature data. Part I: Homogeneity test for linear trends. Int J Climatol 1997; 17(1): 25-34.
[http://dx.doi.org/10.1002/(SICI)1097-0088(199701)17:1<25::AID-JOC103>3.0.CO;2-J] ]. In other words, K is the number of years. Statistic T (K) to compare the mean of the first K year with that of the last (n-K) year in Eq. (2).
 |
(2) |
 are calculated through the following formula: in Eq. (3)
 |
(3) |
In this equation, Yi is the value of annual set (from 1 to n),
 is the mean of set and S is standard deviation eq. (4).
 |
(4) |
If T0 is greater than a particular critical value, then the null hypothesis is rejected for that significance level (34).
3. RESULTS AND DISCUSSION
Table 1 illustrates some statistical features of precipitable water during three periods of upper-air reanalyzed data. It is observed that the maximum mean of precipitable water (15 mm) belongs to the first period (1948 – 1957). The mean precipitable water of the third period (1979 – 2012) was approximately 1 mm less than that in the other two periods. However, since the coefficient of variation is small in this period, it can be inferred that atmospheric precipitable water of Iran in the third period has experienced less fluctuation compared to that in the other two periods. In all three periods, there is a difference between mean, mode, and median (or Quartile 2). This shows fluctuations and anomalies in atmospheric precipitable water of Iran. Positive skewness is observed in all the three periods, meaning that, in the territory of Iran, the area in which the mean precipitable water is smaller than the annual mean is larger than areas with average precipitable water equal to or greater than the annual mean. Kurtosis is negative in all three periods.

In order to have a better understanding of precipitable water in different periods of upper-air reanalyzed data, average distribution map and spatial distribution map of precipitable water are displayed in Fig. (1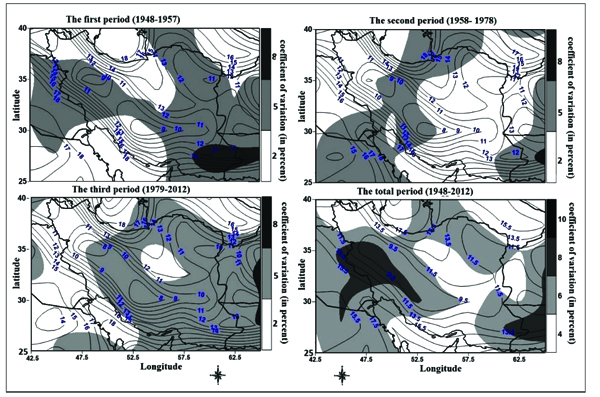 ) for all the three periods of upper-air reanalyzed data (1948 – 1957, 1958 – 1978, and 1979 – 2012). Accordingly, in the first period, the spatial coefficient of variation experienced in the largest area of the country range from 6% to 8%. Nevertheless, the maximum coefficient of variation for precipitable water (10%) belongs to the southeastern part of Iran, especially southern parts of Sistan and Baluchestan. On the other hand, the minimum coefficient of variation (2%) was registered for some spots in central and northwestern Iran. It is observed that spatial factors play an important role in the distribution of precipitable water in Iran. Thus, the minimum average precipitable water was recorded for highlands, while the maximum belonged to coastal areas of the Caspian Sea, the Persian Gulf, and the Gulf of Oman. The condition is a little different in the second period. That is, in this period, the coefficient of variations of precipitable water experienced a decline of about 2%, with the majority of Iran having a coefficient of variation ranging from 4% to 8%. Like the first period, the maximum average of precipitable water was recorded for coastal areas. The average precipitable water in coastal areas experienced a decrease of about 2 mm in the second period (1958 – 1978) compared to the first period (1948 – 1957).
 |
Fig. (1) Spatial average and coefficient distribution of changes of annual precipitable water (mm) during three periods of NCEP/NCAR reanalysis data in upper-air. |
In the third period, the average precipitable water of Iran was not significantly different from that of the other two periods. Nevertheless, its spatial coefficient of variation underwent some changes. More specifically, in this period, the majority area of the country had a coefficient variation of 6% to 10%. Unlike the other two periods, the maximum precipitable water was recorded for southeastern and southwestern parts of the country, with the maximum amount of southeastern area being larger than that of the southwestern region. In all the three periods, the average precipitable water was larger in central parts of the country in comparison with highlands of the Zagros. During the same time, however, atmospheric precipitations of the Zagros were much larger than central regions of Iran. This condition might be attributed to the low dew point temperature in highlands of the Zagros and high water vapor pressure of central regions of Iran [35Asakereh H, Doostkamian M. Tempo-Spatial changes of perceptible water in the atmosphere of iran. Iran Water Resources Research 2014; 10(1): 72-86.].
Fig. (2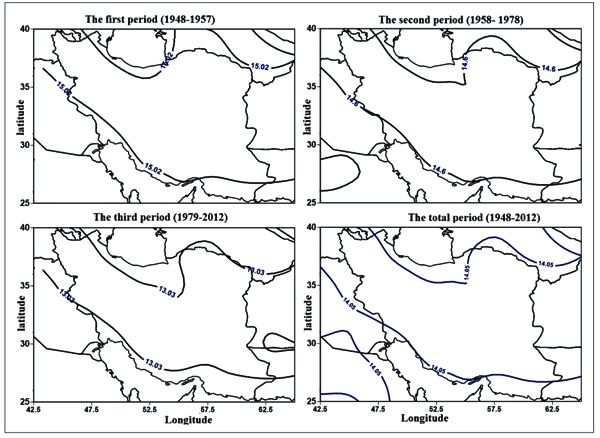 ) shows fluctuations in the average precipitable water of Iran (mm) during the three periods of upper-air reanalyzed data and the average fluctuations during the whole period (1948 – 2012). It is observed that, in the first period, a small proportion of the country had an average equal to or greater than that of annual precipitable water (15.02 mm). Nonetheless, average axes in this period (1948 – 1957) are only limited to coastal areas of Iran. In the second period (1958 – 1978), average axes were further away from coastal areas and, compared to the third period (1979 – 2012), a smaller area of the country has an average precipitable water which is equal to or greater than that of the annual precipitable water (14.6 mm). However, the average atmospheric precipitable water experienced a decline in the second period compared to the first one (1948 – 1957). Finally, in the third period (1979 – 2012), the average precipitable water moved toward central parts of Iran. It is observed that, in this period, over half of the area of Iran had an average precipitable water that was less than that of annual precipitable water (13.03 mm). This condition indicates that, in the third period, fluctuations of average precipitable water were less than those in the other two periods (see coefficients of variations and differences among measures of central tendency in Table 1. The coefficient of skewness in this period further supports this claim (Table 1 and Fig. 2).
 |
Fig. 2 Spatial distributions in the average axis of atmospheric annual precipitable water (mm) of Iran during three periods of NCEP/NCAR reanalysis data in upper-air. |
3.1. Periodic Fluctuations in the Trend of Precipitable water
Fig. (3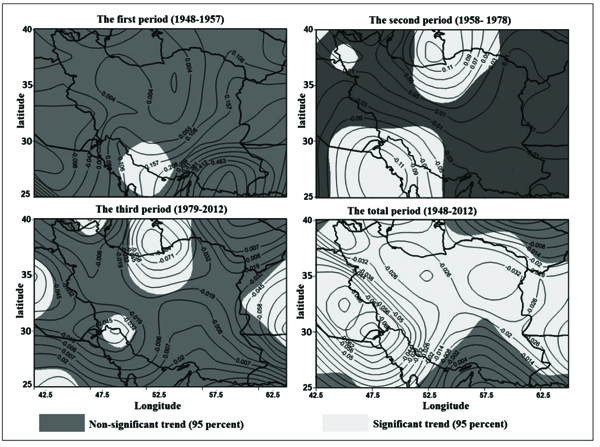 ) displays fluctuations in the annual precipitable water of the three periods of upper-air reanalyzed data (1948 – 1957, 1958 – 1978, and 1979 – 2012). It is observed that, in the first period, 70.8% of the country’s area experienced an increasing trend in the amount of precipitable water. However, except of a small proportion of southern parts of Iran (Bushehr and Fars Provinces), this increasing trend was not statistically significant for the rest of the country (Fig. 3 and Table 2).
 |
Fig. (3) Trend of changes in annual precipitable water during different periods of NCEP/NCAR reanalysis data in upper-air. |
In the second period, half of the country had an increasing trend in the amount of precipitable water, while the other half experienced a declining tendency. With respect to the regions where a decreasing trend was observed, only 8.3% of the area had a statistically significant decline. This mainly included areas which had an increasing trend in the amount of precipitable water during the first period. In the second period, the amount of precipitable water had a statistically significant increasing trend in some northern and northwestern parts of Iran. Opposed to the first period, over 70% of the country’s area experienced a decreasing trend in the amount of precipitable water during the third period. More precisely, about 78.9% area of Iran had a declining trend in this period. In 21.12% of the area, this decrease was statistically significant Table 2. In the third period, eastern coastal areas of the Caspian Sea and some parts of northeastern Iran experienced a declining trend in the amount of precipitable water. In contrast, these areas had a rising trend during the second period. In total, moving from the first period (1948 – 1957) to the third one (1979 – 2012), the area with increasing trend of precipitable water shrank; thus, in the third period, the largest area of the country (79.2%) had a declining trend.
In general, the largest proportion of Iran experienced a falling trend. Only 83% of the country’s area had a rising trend, which was not statistically significant Table 2. According to Table 2, in the first period, about 70.8% of the country’s area had a declining trend. Out of this area, only 1.8% had a statistically measurable decline, with the rest (68.8%) experiencing an insignificant fall. In the second period, about half of the country experienced a declining trend. However, over 45% of this area did not have a significant decline in precipitable water. Overall, it is observed that 90% of Iran’s area experienced a declining trend in the amount of precipitable water. Out of this area, 83.3% had a significant fall at the significance level of 95%. Fig. (4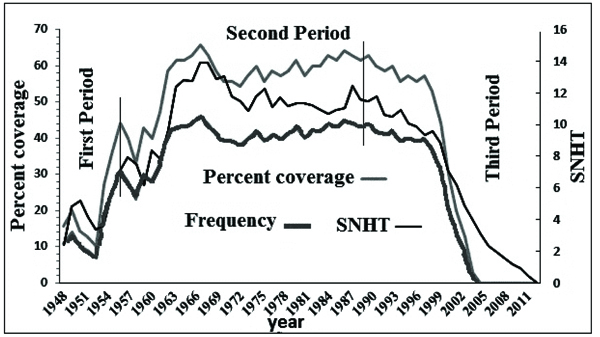 ) illustrates the results of Alexandersson statistical method for various periods. It is observed that the average precipitable water experienced a lot of fluctuations. For example, in the eastern part of the country, the amount of precipitable water had a shift during 30 years of the studied periods. Nevertheless, in the first period of upper-air reanalyzed data, only eastern parts of the country had a shift. In the second period (1958 – 1978), most of the areas in Iran had average shift; nonetheless, in coastal areas in northern and southern parts of the country and some regions in northwestern Iran, the amount of shift was insignificant. This condition can be attributed to the profound effect of the huge humidity resource in these regions, which experienced less fluctuations compared to other parts of the country. In the third period, the intensity of shifts dwindled. Thus, in large areas of southern and southeastern Iran, almost no shift was observed. Fig. (4) indicates the frequency and percentage of the amount of precipitable water for three periods as obtained through Alexandersson statistical method. It is observed that the amount of precipitable water had the largest number of shifts during the third period.

CONCLUSION
The atmosphere, which is the vital air around the earth, is under the constant influence of various factors such as earth’s movement and rotation and regional temperatures in different parts of the earth. These influences lead to various atmospheric movements as a result of changes in pressure and temperature. Humans’ life is intertwined with these changes in nature and the way such resources are exploited. Therefore, it is essential for us to know how these changes happen. The current study aimed at investigating fluctuations in atmospheric precipitable water of Iran during three periods of upper-air reanalyzed data (1948 – 1957, 1958 – 1978, and 1979 – 2012). To this end, pressure and specific humidity data for these periods of upper-air reanalyzed data were retrieved and analyzed. The results of studying the average of spatial coefficient of variation showed that during the first and second periods (1948 – 1957 & 1958 – 1978) that was considerably greater than the third period (1979 – 2012). On the other hand, it was observed that the third period experienced less fluctuations in the amount of precipitable water. The results of studying trends of precipitable water in the periods of upper-air reanalyzed data showed that, in the first period, over 70% of Iran’s area had a rising trend. This increasing tendency, however, was not statistically significant. In this period, only a small part of coastal areas of the Persian Gulf had a significant rising trend. By the same token, in the second period, the largest proportion of the country’s area did not follow a significant trend. Only northern and southern coastal areas of the country experienced a statistically measurable trend in this period. Finally, in the third period, about 78.9% of the country’s area had a declining trend. In total, 21.12% of this area followed a significant pattern. Overall, tracing the process form the first period (1948 – 1957) to the third one (1979 – 2012) shows that the rising trend of precipitable water was replaced by a falling pattern. A case study of the vertical profile of weather that caused destructive summer rainfall in Mashahd came to a similar conclusion [36Mousavi BS, Ashraf B. The investigation of vertical profile of weather that caused destroyer summer rainfall (case study: mashhad). J Water Soil 2010; 24(10): 1036-48.]. In total, precipitable water has experienced a falling trend in recent periods. This finding is also in line with the results obtained by Asakereh and Doostkamian, who investigated the long-term trend of precipitable water and demonstrated that it followed a falling trend in all studied hours all across Iran. They stated that this trend was statistically significant at the level of 95% for over 70% of the country’s area. However, they showed that southeastern regions of the country failed to have any significant trend, though this region followed a declining trend too [35Asakereh H, Doostkamian M. Tempo-Spatial changes of perceptible water in the atmosphere of iran. Iran Water Resources Research 2014; 10(1): 72-86.]. The results of Alexandersson statistical method also indicated that the biggest shift in average precipitable water was experienced in the third period. Therefore, changes in measurement tools and hours during the past two periods, especially the first period, have not caused any shift in the average precipitable water. In total, from the first period to the third period, the amount of atmospheric precipitable water in the study area have had a reducing trend.
CONSENT FOR PUBLICATION
Not applicable.
CONFLICTS OF INTEREST
The authors declare no conflict of interest, financial or otherwise.
ACKNOWLEDGEMENTS
The authors would like to thank the NOAA-CIRES Climate Diagnostics Center, Boulder, Colorado, USA, which presented NCEP/NCAR data.
REFERENCES
| [1] | Masoudian SA. Climate of Iran 1 1st ed. 2011; 288. |
| [2] | Rousta I, Khosh A. F, Soltani M, Modir T. Sh S. Assessment of blocking effects on rainfall in northwestern Iran. COMECAP 2014; Heraklion-Grecce: COMECAP; 2014: 127-32. |
| [3] | Azizi G, Mohammadi H, Karimi M, Shamsipour AA, Rousta I. The relationship between the Arctic Oscillation and North Atlantic Blocking Frequency. Open J Atmos Clim Changes 2015. |
| [4] | Sadeghi HS, Hajam S, Tofangsaz P. A study of the relationship between precipitable water And observed precipitation over tehran. J The Earth Space Phys 2005; 31(2): 13-21. |
| [5] | Rousta I, Doostkamian M, Haghighi E, Mirzakhani B. Statistical-synoptic analysis of the atmosphere thickness pattern of iran’s pervasive frosts. Climate (Basel) 2016; 4(3): 41. [http://dx.doi.org/10.3390/cli4030041] |
| [6] | Rousta I, Doostkamian M, Haghighi E, Ghafarian M. HR, Yarahmadi P. Analysis of spatial autocorrelation patterns of heavy and super heavy rainfall in Iran. Adv Atmos Sci 2017; 1(1): 1-18. |
| [7] | Rousta I, Doostkamian M, Taherian A, Haghighi E, Ghafarian M H, Ólafsson H. Investigation of the spatio-temporal variations in atmosphere thickness pattern of iran and the middle east with special focus on precipitation in iran. Climate 2017; 5(4): 1-82. [http://dx.doi.org/10.3390/cli5040082] |
| [8] | Rousta I, Nasserzadeh M, Jalali M, et al. Decadal spatial-temporal variations in the spatial pattern of anomalies of extreme precipitation thresholds (Case Study: Northwest Iran). Atmosphere 2017; 8(8): 135. |
| [9] | Gutman SI, Susan RS, Benjamin SG, et al. Rapid retrieval and assimilation of ground based GPS precipitable water observations at the NOAA Forecast Systems Laboratory: Impact on weather forecasts. J Meteorol Soc Japan Ser II 2004; 82(1B): 351-60. [http://dx.doi.org/10.2151/jmsj.2004.351] |
| [10] | Mobasheri MR, Poorbager K SM, Farajzadeh A M, Sadeghi N A. Total precipitable water (TPW) assessment using MODIS images radiosonde data (Case study: Tehran District). Sci Res J Spat Plann 2010; 14(1): 107-26. |
| [11] | Kassomenos P, McGregor G. The interannual variability and trend of precipitable water over southern Greece. J Hydrometeorol 2006; 7(2): 271-84. [http://dx.doi.org/10.1175/JHM484.1] |
| [12] | Bokoye A, Royer A, O’Neill N, et al. Multisensor analysis of integrated atmospheric water vapor over Canada and Alaska. J Geophys Res D Atmospheres 2003; 108(D15.) [http://dx.doi.org/10.1029/2002JD002721] |
| [13] | Bony S, Duvel JP. Influence of the vertical structure of the atmosphere on the seasonal variation of precipitable water and greenhouse effect. J Geophys Res D Atmospheres 1994; 99(D6): 12963-80. [http://dx.doi.org/10.1029/94JD00482] |
| [14] | Shine K. Assessing the climate impact of trends in stratospheric water vapor. Geophys Res Lett 2002; 29(6) |
| [15] | Marsden D, Valero FP. Observation of water vapor greenhouse absorption over the Gulf of Mexico using aircraft and satellite data. J Atmos Sci 2004; 61(6): 745-53. [http://dx.doi.org/10.1175/1520-0469(2004)061<0745:OOWVGA>2.0.CO;2] |
| [16] | Fallahe Ghalhari GA. Principles of Meteorology 1 ed. 1. 2011; 870. |
| [17] | Manzato A, Morgan G. Evaluating the sounding instability with the Lifted Parcel Theory. Atmos Res 2003; 67: 455-73. [http://dx.doi.org/10.1016/S0169-8095(03)00059-0] |
| [18] | Stout GE, Mueller EA. Survey of relationships between rainfall rate and radar reflectivity in the measurement of precipitation. J Appl Meteorol 1968; 7(3): 465-78. [http://dx.doi.org/10.1175/1520-0450(1968)007<0465:SORBRR>2.0.CO;2] |
| [19] | Hutchings J. Water-vapor transfer over the Australian Continent. J Meteorol 1961; 18(5): 615-34. [http://dx.doi.org/10.1175/1520-0469(1961)018<0615:WVTOTA>2.0.CO;2] |
| [20] | Rousta I, Soltani M, Zhou W, Cheung HH. Analysis of extreme precipitation events over central plateau of iran. Am J Clim Change 2016; 5(03): 297. [http://dx.doi.org/10.4236/ajcc.2016.53024] |
| [21] | Soltani M, Laux P, Kunstmann H, et al. Assessment of climate variations in temperature and precipitation extreme events over Iran. Theor Appl Climatol 2016; 126(3-4): 775-95. [http://dx.doi.org/10.1007/s00704-015-1609-5] |
| [22] | Adeyemi B. Empirical modeling of layered integrated water vapor using surface mixing ratio in Nigeria. J Appl Meteorol Climatol 2009; 48(2): 369-80. [http://dx.doi.org/10.1175/2008JAMC1929.1] |
| [23] | Karalis JD. Precipitable water and its relationship to surface dew point and vapor pressure in Athens. J Appl Meteorol 1974; 13(7): 760-6. [http://dx.doi.org/10.1175/1520-0450(1974)013<0760:PWAIRT>2.0.CO;2] |
| [24] | Parameswaran K, Murthy BVK. Altitude profiles of tropospheric water vapor at low latitudes. J Appl Meteorol 1990; 29(3): 665-79. 1990/08/01 [http://dx.doi.org/10.1175/1520-0450(1990)029<0665:APOTWV>2.0.CO;2] |
| [25] | Peixóto JP, Oort AH, Street-Perrott A, Beran M, Ratcliffe R. Variations in the global water budget 1983; 5. [http://dx.doi.org/10.1007/978-94-009-6954-4_2] |
| [26] | Tuller SE. World distribution of mean monthly and annual precipitable water. Mon Weather Rev 1968; 96: 785-97. [http://dx.doi.org/10.1175/1520-0493(1968)096<0785:WDOMMA>2.0.CO;2] |
| [27] | Harrison LP. On the water vapor in the atmosphere over the united states east of the rocky mountains. Mon Weather Rev 1931; 59(12): 449-72. [http://dx.doi.org/10.1175/1520-0493(1931)59<449:OTWVIT>2.0.CO;2] |
| [28] | Humphreys W. The amount and vertical distribution of water vapor on clear days. Bull Mountain Wea Obs 1911; 4: 121-8. |
| [29] | Kalnay E, Kanamitsu M, Kistler R, et al. The NCEP/NCAR 40-Year reanalysis project. Bull Am Meteorol Soc 1996; 77(3): 437-71. |
| [30] | Masoodian SA, Asakereh H, Mohammadi B, Halabian AH. Display and proccesing of atmospheric data 1 ed. 1. 2011; 129. |
| [31] | Prakash S, Giri R. Adesh Precipitable Water vapour at santacruz airport mumbai from Radiosonde Measurements: A Study. Int J Phys Math Sci 2012; 2: 120-30. |
| [32] | Doty BE, Kinter JLI. Geophysical data analysis and visualization using the Grid Analysis and Display System. National Aeronautics and Space Administration, Washington, DC (United States), 1995 N--96-25512; NASA-SP--519;NAS--1.21:519;NIPS--96-08516; TRN: 9625535 United States TRN: 9625535 CASI HC A02/MF A03 STAR English. |
| [33] | MATLAB and Statistics Toolbox Release 2014a, inventorThe MathWorks, Inc. United States 2014. |
| [34] | Alexandersson H, Moberg A. Homogenization of Swedish temperature data. Part I: Homogeneity test for linear trends. Int J Climatol 1997; 17(1): 25-34. [http://dx.doi.org/10.1002/(SICI)1097-0088(199701)17:1<25::AID-JOC103>3.0.CO;2-J] |
| [35] | Asakereh H, Doostkamian M. Tempo-Spatial changes of perceptible water in the atmosphere of iran. Iran Water Resources Research 2014; 10(1): 72-86. |
| [36] | Mousavi BS, Ashraf B. The investigation of vertical profile of weather that caused destroyer summer rainfall (case study: mashhad). J Water Soil 2010; 24(10): 1036-48. |