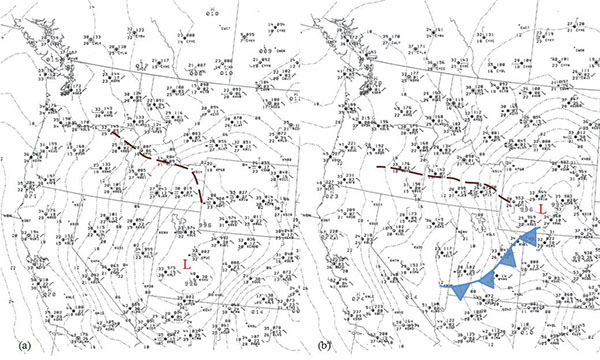
Fig. (4)
MSAS NWS mean sea-level pressure (dotted black lines: hPa) and METAR observations at (a) 1200 UTC and (b) 2100 UTC 26 December 2003 with mean sea-level pressure low (red “L” symbol), surface trough axis (dashed brown line: hPa), and surface cold front (light blue region with triangles).