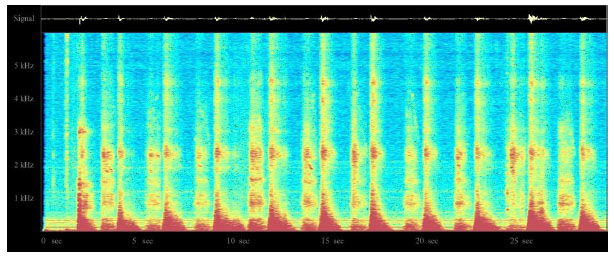
Fig. (9) Sample respiratory sound spectrogram recorded in the authors’ laboratory using a miniature electret microphone embedded in an oxygen mask. The range of frequencies displayed in this figure is 0 Hz to 6000 Hz, with the highest frequency signal components at the top, and the lowest at the bottom. Red areas indicate strongest signal levels, blue areas the weakest nonzero levels: BLACK < BLUE < GREEN < YELLOW < RED. Note that both inspiration and expiration are clearly visible. The time-domain signal is displayed at the very top of the image.