- Home
- About Journals
-
Information for Authors/ReviewersEditorial Policies
Publication Fee
Publication Cycle - Process Flowchart
Online Manuscript Submission and Tracking System
Publishing Ethics and Rectitude
Authorship
Author Benefits
Reviewer Guidelines
Guest Editor Guidelines
Peer Review Workflow
Quick Track Option
Copyediting Services
Bentham Open Membership
Bentham Open Advisory Board
Archiving Policies
Fabricating and Stating False Information
Post Publication Discussions and Corrections
Editorial Management
Advertise With Us
Funding Agencies
Rate List
Kudos
General FAQs
Special Fee Waivers and Discounts
- Contact
- Help
- About Us
- Search


The Open Bioactive Compounds Journal
(Discontinued)
ISSN: 1874-8473 ― Volume 9, 2020
Analysis of Raspberry Ketone in Nutraceutical Formulation Using Fourier Transform Infrared Spectrophotometric Method
Hassan Y. Aboul-Enein1, *, Oana Mihaela Antochi2, 3, Gheorghe Nechifor3, Andrei A. Bunaciu4
Abstract
Aims:
A Fourier Transform Infrared (FT-IR) spectrometric method was developed for the rapid, direct measurement of Raspberry Ketone (RK) and Caffeine (CAF) in a nutraceutical formulation.
Methods:
Conventional KBr-spectra and KBr+0.5 mg Microcrystalline Cellulose (MCC)-spectra were used as the basis for a better determination of active substances in the nutraceutical formulation. A calibration model was developed using caffeine and raspberry ketone standards of varying concentrations in the mid-infrared region (4000-400 cm-1). The Beer-Lambert law was used in data processing.
Results:
The results indicate that FT-IR spectrometry is applicable to the analytical quantification of RK and CAF in the nutraceutical formulation.
Conclusion:
The method proposed is simple, precise and not time-consuming compared to the chromatographic methods that are cited in the literature. Quantification is performed in about 10-15 minutes, including sample preparation and spectral acquisition.
Article Information

Identifiers and Pagination:
Year: 2019Volume: 7
First Page: 8
Last Page: 13
Publisher Id: TOBCJ-7-8
DOI: 10.2174/1874847301907010008
Article History:
Received Date: 09/07/2019Revision Received Date: 27/09/2019
Acceptance Date: 17/10/2019
Electronic publication date: 05/12/2019
Collection year: 2019
open-access license: This is an open access article distributed under the terms of the Creative Commons Attribution 4.0 International Public License (CC-BY 4.0), a copy of which is available at: (https://creativecommons.org/licenses/by/4.0/legalcode). This license permits unrestricted use, distribution, and reproduction in any medium, provided the original author and source are credited.
* Address correspondence to this author at the Pharmaceutical and Medicinal Chemistry Department, Pharmaceutical and Drug Industries Research Division, Dokki, Cairo 12622, Egypt; Tel: +00201003678948; Fax: +0020233370931;
E-mail: haboulenein@yahoo.com
| Open Peer Review Details | |||
|---|---|---|---|
| Manuscript submitted on 09-07-2019 |
Original Manuscript | Analysis of Raspberry Ketone in Nutraceutical Formulation Using Fourier Transform Infrared Spectrophotometric Method | |
1. INTRODUCTION
Infrared spectroscopy is a standard analytical technique used to analyze any type of substances, thereby generating images of all atomic vibrations in the compound. Therefore, it is also referred to as vibrational spectroscopy. A classical infrared spectrum is obtained by passing an infrared beam through a sample and then determining the fraction of incident radiation absorbed by the sample at a given wavelength.
Infrared spectrometry allows the identification of pharmaceutical compounds as well as their quantitative analysis and the use of the FTIR technique ensures the continuous monitoring of the baseline and the simultaneous analysis of several different components in the same sample [1Moffat AC. Clarke’s Isolation and Identification of Drugs. The Pharmaceutical Society of Great Britain 2nd ed. 1986.-8Krishna GM, Muthukumaran M, Krishnamoorthy B, Nishat AA. Critical review on fundamental and pharmaceutical analysis of FT-IR spectroscopy. Int J Pharm 2013; 3: 396-402.]. FTIR is an efficient technique for pharmaceutical analysis because it is easy to use, sensitive, and fast.
Raspberry Ketone (I, RK) (also known as 4-(4-hydroxyphenyl) butan-2-one) is a compound extracted from red raspberries that is usually used as a scenting and flavoring agent in foods and cosmetics [9Lin CH, Ding HY, Kuo SY, Chin LW, Wu JY, Chang TS. Evaluation of in vitro and in vivo depigmenting activity of raspberry ketone from Rheum officinale. Int J Mol Sci 2011; 12(8): 4819-35.
[http://dx.doi.org/10.3390/ijms12084819] [PMID: 21954327] ].
1.1. Chemical Structures
Numerous researches have been carried out to determine the biological effects of the raspberry components, thus obtaining numerous results. For example, the ellagic acid is reported to inhibit tumor inductions in the liver, lungs and esophagus only in tumour cell lines and animal models [10Ravai M. Quality characteristics of raspberries and blackberries. Cereal Foods World 1996; 41: 773-5.]. It is presumed that RK might influence the lipid metabolism in ways similar to capsaicin and synephrine. The effects of RK on obesity and lipid metabolism were examined by Morimoto et al. [11Morimoto C, Satoh Y, Hara M, Inoue S, Tsujita T, Okuda H. Anti-obese action of raspberry ketone. Life Sci 2005; 77(2): 194-204.
[http://dx.doi.org/10.1016/j.lfs.2004.12.029] [PMID: 15862604] ].
RK is found naturally in many foods, most notably raspberries, but also in Rheum officinale [12Tateiwa JI, Horiuchi H, Hashimoto K, Yamauchi T, Uemura S. Cation-exchanged montmorillonite-catalyzed facile Friedel-Crafts alkylation of hydroxy and methoxy aromatics with 4-hydroxybutan-2-one to produce raspberry ketone and some pharmaceutically active compounds. J Org Chem 1994; 59: 5901-4.
[http://dx.doi.org/10.1021/jo00099a017] ].
Dietary intake is estimated to be about 0.42mg/kg bodyweight [13Park KS. Raspberry ketone increases both lipolysis and fatty acid oxidation in 3T3-L1 adipocytes. Planta Med 2010; 76(15): 1654-8.
[http://dx.doi.org/10.1055/s-0030-1249860] [PMID: 20425690] ], consumed through processed foods where raspberry ketone is added as a flavoring agent.
Raspberry ketone quantitative determination has been performed using using polarographic technique polarography [14Zhang ZH, Xu LM, Yao BQ. Spectrophotometry determination of raspberry ketone. J Beijing Inst Petrochemieal Tech 2005; 13: 15-6.], spectrometry [15Wang L, Wang Y, Zhang Y, Meng X, Yang L, Zhang F. Determination of raspberry ketone in raspberry by high performance liquid chromatography tandem mass spectrometry. International Conference on Human Health and Biomedical Engineering August 19-22, 2011; Jilin, China. ] and liquid chromatography - mass spectrometry [16Al-Othman ZA, Al-Warthan A, Aboul-Enein HY, Al Za’abi M, Ali I. Mechanistic approaches of PhE and PPF columns separation for rasberry ketone and caffeine. J Liq Chromatogr Relat Technol 2015; 38: 1324-32.
[http://dx.doi.org/10.1080/10826076.2015.1048874] -18Aprea E, Biasioli F, Gasperi F. Volatile compounds of raspberry fruit: from analytical methods to biological role and sensory impact. Molecules 2015; 20(2): 2445-74.
[http://dx.doi.org/10.3390/molecules20022445] [PMID: 25647579] ]. The-HPLC separation of raspberry ketone and caffeine on phenyl columns (PhE and PPF) has also been described [16Al-Othman ZA, Al-Warthan A, Aboul-Enein HY, Al Za’abi M, Ali I. Mechanistic approaches of PhE and PPF columns separation for rasberry ketone and caffeine. J Liq Chromatogr Relat Technol 2015; 38: 1324-32.
[http://dx.doi.org/10.1080/10826076.2015.1048874] ].
Caffeine (II, CAF) (3, 7-dihydro-1,3,7-trimethyl-1H-purine-2,6-dione or 1,3,7- trimethylxanthine) is a central nervous system and metabolic stimulant, which is used both recreationally and medically to reduce physical fatigue and to restore alertness when drowsiness occurs [19Nehlig A. Are we dependent upon coffee and caffeine? A review on human and animal data. Neurosci Biobehav Rev 1999; 23(4): 563-76.
[http://dx.doi.org/10.1016/S0149-7634(98)00050-5] [PMID: 10073894] -21Nkondjock A. Coffee consumption and the risk of cancer: an overview. Cancer Lett 2009; 277(2): 121-5.
[http://dx.doi.org/10.1016/j.canlet.2008.08.022] [PMID: 18834663] ]. It produces increased wakefulness, faster and clearer flow of thought, increased focus, and better general body coordination. Caffeine's most notable pharmacological effect is as a central nervous system stimulant, increasing alertness and producing agitation. It also acts as a urinary stimulant.
Caffeine is used in some headache and migraine medications, in certain dietary supplements used for weight loss and in many popular energy drinks [22Santos JR, Rangel AOSS. Determination of caffeine in coffee using low-pressure chromatography.Coffee in Health and Disease Prevention 2015; 983-91.
[http://dx.doi.org/10.1016/B978-0-12-409517-5.00108-X] ].
Caffeine quantitative determination has been performed using different techniques ranging from liquid chromatography to spectrometry [23van Koert RR, Bauer PR, Schuitema I, Sander JW, Visser GH. Caffeine and seizures: A systematic review and quantitative analysis. Epilepsy Behav 2018; 80: 37-47.
[http://dx.doi.org/10.1016/j.yebeh.2017.11.003] [PMID: 29414557] -28Corciova A, Ivanescu B. Determination of caffeine content from different pharmaceutical and natural products. Eur Chem Bull 2014; 5: 138-41.].
The main objective of this work was to develop a new procedure for the fast and accurate simultaneously determination of RK and CAF in commercial nutraceutical formulations containing 100 mg RK and 50 mg CAF per tablet, by using the Beer-Lambert law thus reducing the steps required for sample pre-treatment and providing direct FTIR measurement.
2. EXPERIMENTAL
2.1. Apparatus
Data acquisition was performed using a Frontier Two System FT-IR spectrometer equipped with Spectrum for Windows v.5.01 (Perkin Elmer Co., Beaconsfield, Bucks, UK). The commercial softwares used were QUANT+ expert v/4.51 and Spectrum Beers’s law v.2.01 (Perkin Elmer Co.,UK) to generate data for the principal component analysis. All the FT-IR spectra were scanned between 4000 and 400 cm-1, by averaging 32 scans for each spectrum with a resolution of 4 cm-1 (data point resolution/interval 1 cm-1) and were recorded with a DTGS detector.
2.2. Reagents and Materials
The standards of RK, CAF and Microcrystalline Cellulose (MCC) were supplied by Sigma Aldrich. For fused KBr disk preparation a potassium bromide IR spectral grade was used (Sigma Aldrich, Steinhein, Germany). The nutraceutical formulation, Ultimate containing 100mg RK/tablet and respectively 50mg CAF/tablet, manufactured by WELLNX – Willington Delaware, USA, was purchased from the local market.
The principal excipient used in the tablet formulation is Microcrystalline Cellulose (MCC).
2.3. Recommended Procedures
The standards were prepared by compressing 2.0 mg of substance with spectral grade KBr (up to 200mg), while the background was spectral grade KBr. Each spectrum was collected three times for the same cup after rotation with 1200. The mean of the spectra was then used in the following analysis steps.
For the calibration curve of RK, we used samples prepared by compressing a standard substance RK in spectral grade KBr, while the background was 0.5 mg MCC in KBr (calibration was made using four levels: 0.1, 0.2, 0.3 and 0.4 mg respectively). For the calibration curve of CAF, spectra were recorded from samples prepared by compressing a standard substance CAF in spectral grade KBr, while the background was 0.5 mg MCC in KBr (calibration was made using four points 0.05, 0.1, 0.15 and 0.2 mg respectively).
For the drug determination, the spectra were performed in two different ways:
- Conventional fused KBr disk spectra were recorded from the samples prepared by compressing 2.0mg of drug sample with spectral grade KBr, while the background was spectral grade KBr [Drug -KBr].
- Conventional fused KBr disk spectra were recorded from samples prepared by compressing 2.0 mg of drug sample with spectral grade KBr, while the background was 0.5mg MCC in KBr [Drug-MCC].
Experimental parameters, such as calibration methods, were compared and recommendations on the best options for RK and CAF analysis were made.
3. RESULTS AND DISCUSSION
Fig. (1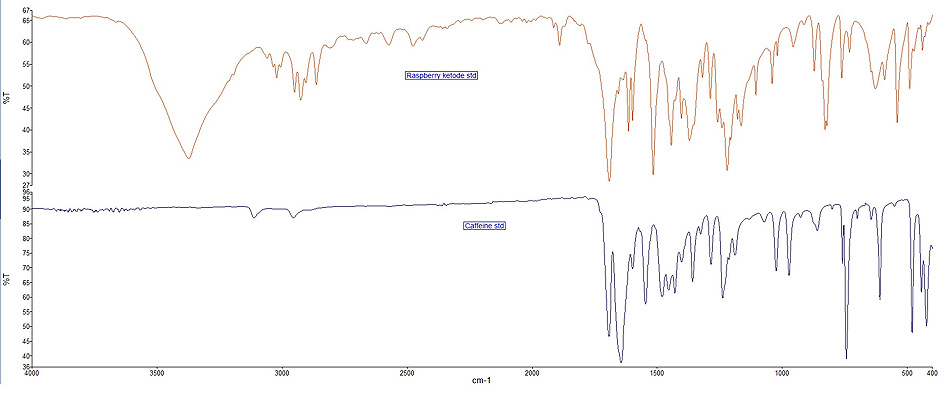 ) presents the mean spectra for RK and CAF standards using the KBr disk method while the spectra of the nutraceutical formulation are presented in Fig. (2
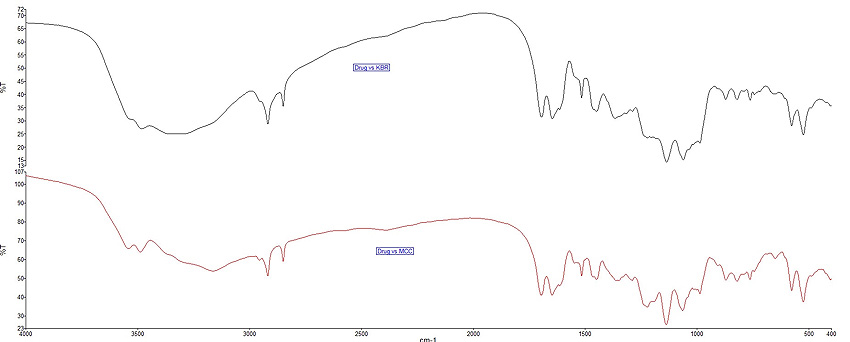 ).
).
We studied the possibility of using the Beer-Lambert law for the quantitative determination of RK and CAF in nutraceutical tablet formulation at 1516 cm-1 for RK, corresponding to p-OH stretching, and at 746 cm-1 for CAF, corresponding to amino group. Figs. (3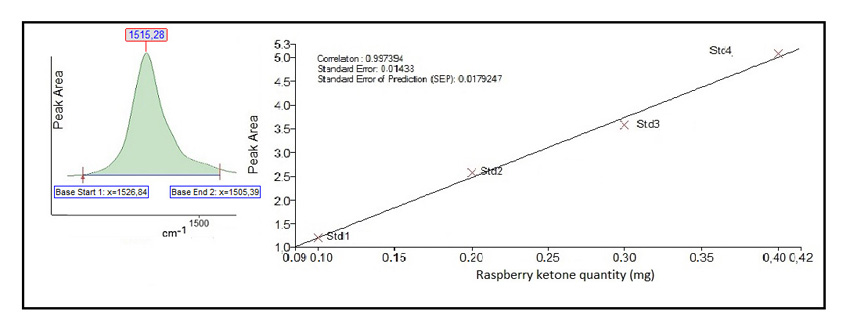 and 4
and 4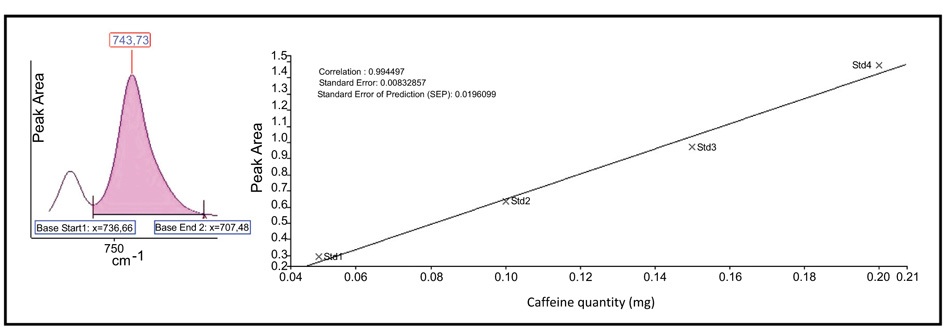 ) present the calibration graphs for the active principle RK and CAF respectively, taking into account the peak area calculated.
 |
Fig. (1) FT-IR spectra of RK and CAF standards in KBr-disk. |
 |
Fig. (2) FT-IR spectra of drug formulations. |
 |
Fig. (3) Beer-Lambert law calibration curve for RK determination in pharmaceutical preparations. |
 |
Fig. (4) Beer-Lambert law calibration curve for CAF determination in pharmaceutical preparations. |
The measurements, carried out under the previously mentioned conditions, providing a typical calibration line which corresponds to:
A= - 0.0367 + 12.6278 C (mgRK) (R2 = 09974)
A= - 0.1251 + 7.7848 C (mgCAF) (R2 = 09945)
As can be seen in Table 1, the results are very similar, and we suggest the use of the Beer-Lambert law method, because of the smaller value of RSD (< 3.0%).
For the validation of the method the principal parameters of the procedure were studied.
The linearity was studied for both analytes, and as presented in Figs. (3 and 4) good correlation coefficients were obtained (R2>0.995).
The sensitivity of the method was established by determining Limits of Detection (LOD) and Limits of Quantification (LOQ). Both parameters were determined according to the ICH guidelines [29https://www.ich.org/fileadmin/Public_Web_Site/ICH_Products/Guidelines/Quality/Q2_R1/Step4/Q2_R1_-Guideline.pdf]. The low LOD and LOQ values presented in Table 2 show the good confirm the good sensitivity of the method.

The precision of the method was studied in two days inter-day measurements over two days. The values of RSD and RE, presented in Table 2, indicate a good precision of the method. proposed by us.
In Table 2 all the results obtained after the validation of the FTIR method are presented.
CONCLUSION
The results indicate that FT-IR spectrometry can be employed for the analytical quantification of RK and CAF in a nutraceutical formulation using commercial software. The method proposed is simple, precise and not time-consuming compared to the chromatographic methods cited in the literature. Quantification is performed in about 10-15 minutes, including sample preparation and spectral acquisition.
ETHICS APPROVAL AND CONSENT TO PARTICIPATE
Not applicable.
HUMAN AND ANIMAL RIGHTS
No animals/humans were used for studies that are the basis of this research.
CONSENT FOR PUBLICATION
Not applicable.
AVAILABILITY OF DATA AND MATERIALS
Not applicable.
FUNDING
None.
CONFLICT OF INTEREST
The authors declare no conflict of interest, financial or otherwise.
ACKNOWLEDGEMENTS
Declared none.
REFERENCES
| [1] | Moffat AC. Clarke’s Isolation and Identification of Drugs. The Pharmaceutical Society of Great Britain 2nd ed. 1986. |
| [2] | Miller BE, Danielson ND, Katon JE. Aqueous infrared pharmaceutical analysis of two choline compounds by flow injection analysis using the circle cell. Appl Spectrosc 1988; 42: 401-5. [http://dx.doi.org/10.1366/0003702884427933] |
| [3] | McClure WF. Analysis Using Fourier Transforms.Handbook of Near-Infrared Analysis 1992; 181-274. |
| [4] | Ciurczak EW, Drennen JK III. Pharmaceutical and medical applications of near- infrared spectroscopy 2001; 73-105. |
| [5] | Liu Z, Jiao YH, Zhang DY. Single-sweep polarographic studies on raspberry ketone. Chin J Anal Lab 2003; 22: 168. |
| [6] | Bunaciu AA, Aboul-Enein HY, Fleschin S. Application of fourier transform infrared spectrometry in pharmaceutical drugs analysis. Appl Spectrosc Rev 2010; 45: 206-19. [http://dx.doi.org/10.1080/00387011003601044] |
| [7] | Bunaciu AA, Aboul-Enein HY. Vibrational spectroscopy applications in drug analysis. Encyclopedia of Spectroscopy and Spectrometry, 3rd ed, London JC, Tranter GE, and Koppenaal DW (eds) 2017; 4: 575-81. |
| [8] | Krishna GM, Muthukumaran M, Krishnamoorthy B, Nishat AA. Critical review on fundamental and pharmaceutical analysis of FT-IR spectroscopy. Int J Pharm 2013; 3: 396-402. |
| [9] | Lin CH, Ding HY, Kuo SY, Chin LW, Wu JY, Chang TS. Evaluation of in vitro and in vivo depigmenting activity of raspberry ketone from Rheum officinale. Int J Mol Sci 2011; 12(8): 4819-35. [http://dx.doi.org/10.3390/ijms12084819] [PMID: 21954327] |
| [10] | Ravai M. Quality characteristics of raspberries and blackberries. Cereal Foods World 1996; 41: 773-5. |
| [11] | Morimoto C, Satoh Y, Hara M, Inoue S, Tsujita T, Okuda H. Anti-obese action of raspberry ketone. Life Sci 2005; 77(2): 194-204. [http://dx.doi.org/10.1016/j.lfs.2004.12.029] [PMID: 15862604] |
| [12] | Tateiwa JI, Horiuchi H, Hashimoto K, Yamauchi T, Uemura S. Cation-exchanged montmorillonite-catalyzed facile Friedel-Crafts alkylation of hydroxy and methoxy aromatics with 4-hydroxybutan-2-one to produce raspberry ketone and some pharmaceutically active compounds. J Org Chem 1994; 59: 5901-4. [http://dx.doi.org/10.1021/jo00099a017] |
| [13] | Park KS. Raspberry ketone increases both lipolysis and fatty acid oxidation in 3T3-L1 adipocytes. Planta Med 2010; 76(15): 1654-8. [http://dx.doi.org/10.1055/s-0030-1249860] [PMID: 20425690] |
| [14] | Zhang ZH, Xu LM, Yao BQ. Spectrophotometry determination of raspberry ketone. J Beijing Inst Petrochemieal Tech 2005; 13: 15-6. |
| [15] | Wang L, Wang Y, Zhang Y, Meng X, Yang L, Zhang F. Determination of raspberry ketone in raspberry by high performance liquid chromatography tandem mass spectrometry. International Conference on Human Health and Biomedical Engineering August 19-22, 2011; Jilin, China. |
| [16] | Al-Othman ZA, Al-Warthan A, Aboul-Enein HY, Al Za’abi M, Ali I. Mechanistic approaches of PhE and PPF columns separation for rasberry ketone and caffeine. J Liq Chromatogr Relat Technol 2015; 38: 1324-32. [http://dx.doi.org/10.1080/10826076.2015.1048874] |
| [17] | Yuan B, Zhao D, Du R, et al. A highly sensitive ultra-high performance liquid chromatography/tandem mass spectrometry method with in-source fragmentation for rapid quantification of raspberry ketone. J Food Drug Anal 2019; 27(3): 778-85. [http://dx.doi.org/10.1016/j.jfda.2018.07.005] [PMID: 31324293] |
| [18] | Aprea E, Biasioli F, Gasperi F. Volatile compounds of raspberry fruit: from analytical methods to biological role and sensory impact. Molecules 2015; 20(2): 2445-74. [http://dx.doi.org/10.3390/molecules20022445] [PMID: 25647579] |
| [19] | Nehlig A. Are we dependent upon coffee and caffeine? A review on human and animal data. Neurosci Biobehav Rev 1999; 23(4): 563-76. [http://dx.doi.org/10.1016/S0149-7634(98)00050-5] [PMID: 10073894] |
| [20] | Massey LK, Sutton RA. Acute caffeine effects on urine composition and calcium kidney stone risk in calcium stone formers. J Urol 2004; 172(2): 555-8. [http://dx.doi.org/10.1097/01.ju.0000129413.87024.5c] [PMID: 15247728] |
| [21] | Nkondjock A. Coffee consumption and the risk of cancer: an overview. Cancer Lett 2009; 277(2): 121-5. [http://dx.doi.org/10.1016/j.canlet.2008.08.022] [PMID: 18834663] |
| [22] | Santos JR, Rangel AOSS. Determination of caffeine in coffee using low-pressure chromatography.Coffee in Health and Disease Prevention 2015; 983-91. [http://dx.doi.org/10.1016/B978-0-12-409517-5.00108-X] |
| [23] | van Koert RR, Bauer PR, Schuitema I, Sander JW, Visser GH. Caffeine and seizures: A systematic review and quantitative analysis. Epilepsy Behav 2018; 80: 37-47. [http://dx.doi.org/10.1016/j.yebeh.2017.11.003] [PMID: 29414557] |
| [24] | Levent A. HPLC Method for the analysis of paracetamol, caffeine and dipyrone. Turk J Chem 2002; 26: 521-8. |
| [25] | Güzin A, Kadir K, Sungur S. Derivative spectrophotometric determination of caffeine in some beverages. Turk J Chem 2002; 26: 295-302. |
| [26] | Wanyika HN, Gatebe EG, Gitu LM, Ngumba EK, Maritim CW. Determination of caffeine content of tea and instant coffee brands found in the Kenyan market. Afr J Food Sci 2010; 4: 353-8. |
| [27] | Sethuraman S, Radhakrishnan K, Solomon TA. Analytical method development and validation of caffeine in tablet dosage form by using UV- spectroscopy. Int J Novel Trends Pharm Sci 2013; 3: 82-6. |
| [28] | Corciova A, Ivanescu B. Determination of caffeine content from different pharmaceutical and natural products. Eur Chem Bull 2014; 5: 138-41. |
| [29] | https://www.ich.org/fileadmin/Public_Web_Site/ICH_Products/Guidelines/Quality/Q2_R1/Step4/Q2_R1_-Guideline.pdf |