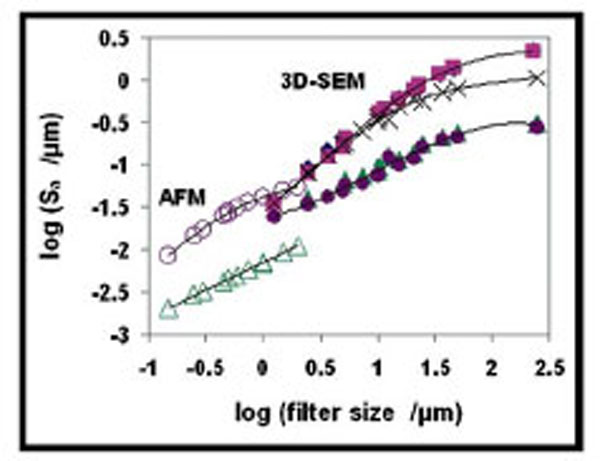
Fig. (5) Log (Sa) as a function of log(filter size/μm) for all surfaces analysed. Values obtained from the 3D-SEM techniques are plotted as filled symbols while AFM results are shown as empty symbols. The lines are presented expressively to guide the eye. The unfiltered AFM data are encircled in the figure. ♦ = CB, ■ = CB+HF, × = FB, ▲ = TS, ● = TS+HF. Unfilled symbols represent AFM data.