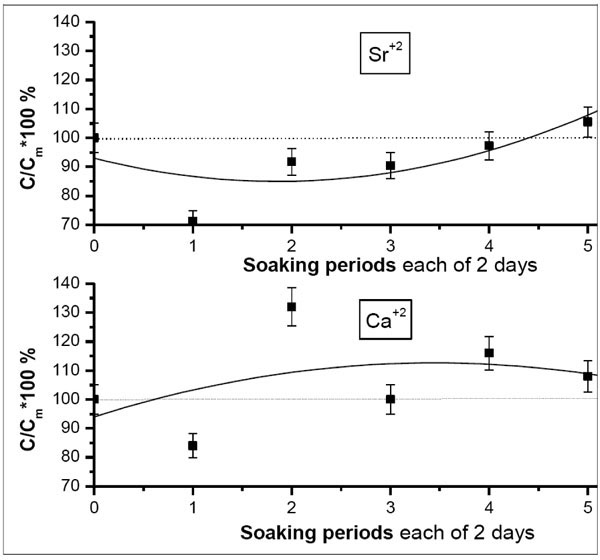
Fig. (4)
Variation of the percentage fraction of Ca
+2
vs
Sr
+2
post each soaking periods in 1.5 × Sr-c-SBF. The drawn curves represent the polynomial fitting of the second order to the obtained results.