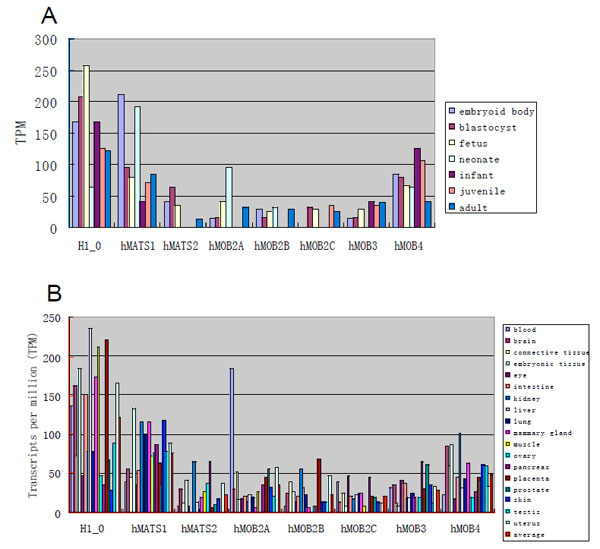
Fig. (5) Expression levels of human MOB genes in different tissues. The transcript levels of human MOB genes were obtained from EST
profiles of UniGene in NCBI. Y axis represents the number of transcripts per million (TPM). X axis shows the control gene (H1 histone
member 0) and all seven human MOB genes. Tissues and developmental stages are assigned with different colors. (A) Breakdown by developmental
stages displays the expression levels of H1_0 and human MOB genes in embryoid body, blastocyst, fetus, neonate, infant, juvenile
and adult stages. Numbers of ESTs from neonate and infant are below 5x10⁴. There are more than 5x10⁴ ESTs analyzed for other stages (Table
S2). (B) Breakdown by tissues represents expression levels of H1_0 and human MOB genes in 18 representative tissues. There are at
least 105 ESTs analyzed for each of the 18 tissues (Table S2).