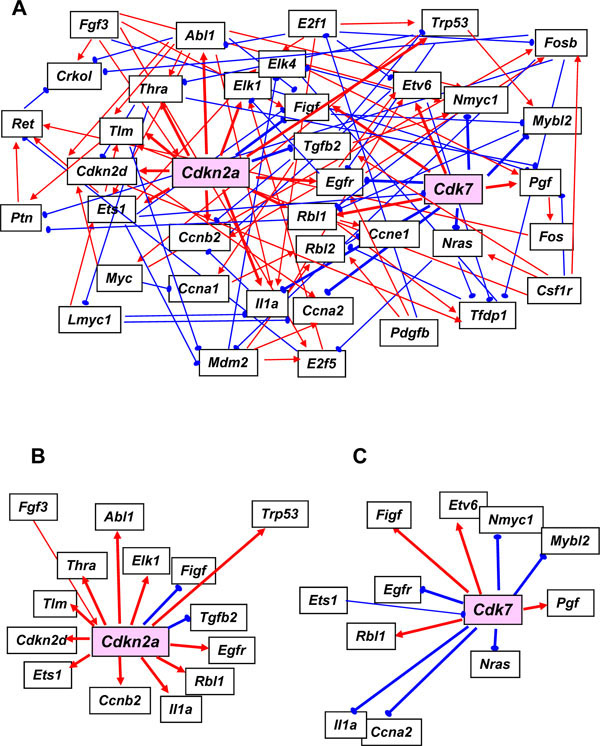
Fig. (2) Representative maps and expression graphs of the transcriptional regulatory networks for selected genes associated with cell-cycle
control in MEF cells. Shown are (A) the network identified for the G0 course data and also the isolated linkages associated with nodal genes
Cdkn2a (B) and Cdk7 (C). Bold lines indicate linkages from Cdkn2a or Cdk7 as a nodal gene. Red arrows indicate linkages associated with
upregulation and blue arrows indicate linkages associated with downregulation for any two genes within the network.