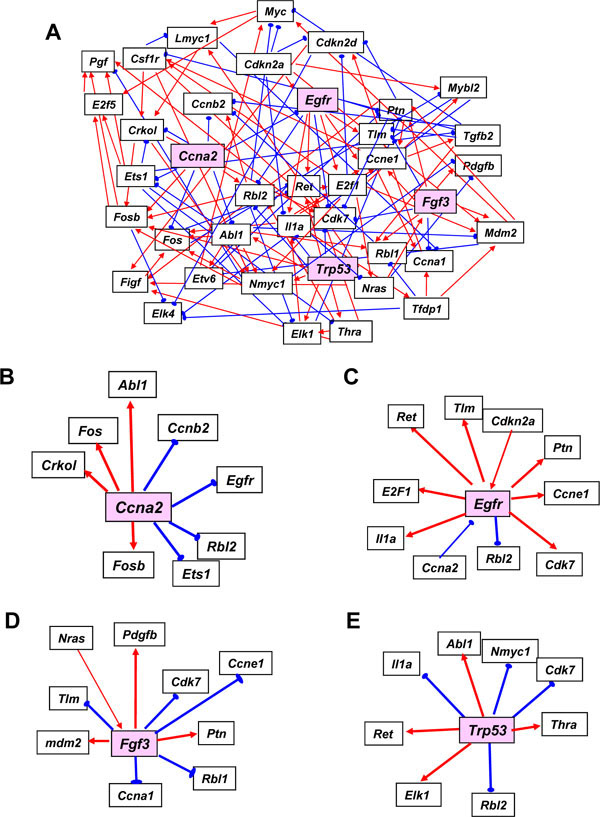
Fig. (3) Networks identified for the G1/S course data (A) and the isolated linkages associated with nodal genes Ccna2 (B), Egfr (C), Fgf3
(D) and Trp53 (E). Red arrows indicate linkages associated with upregulation and blue arrows indicate linkages associated with
downregulation for any two genes within the network. Bold lines indicate linkages with nodal genes.