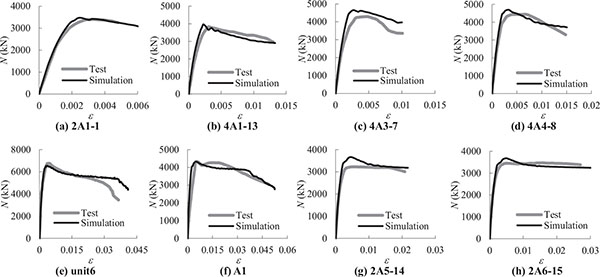
Fig. (5)
Comparison between Predicted and Measured
N
–
ε
Curves for Specimens with Configuration A.