- Home
- About Journals
-
Information for Authors/ReviewersEditorial Policies
Publication Fee
Publication Cycle - Process Flowchart
Online Manuscript Submission and Tracking System
Publishing Ethics and Rectitude
Authorship
Author Benefits
Reviewer Guidelines
Guest Editor Guidelines
Peer Review Workflow
Quick Track Option
Copyediting Services
Bentham Open Membership
Bentham Open Advisory Board
Archiving Policies
Fabricating and Stating False Information
Post Publication Discussions and Corrections
Editorial Management
Advertise With Us
Funding Agencies
Rate List
Kudos
General FAQs
Special Fee Waivers and Discounts
- Contact
- Help
- About Us
- Search


The Open Cybernetics & Systemics Journal
(Discontinued)
ISSN: 1874-110X ― Volume 12, 2018
A Stochastic Distribution Center Location Model for Earthquake Relief Supplies Based on Monte Carlo Simulation
Zhong Tong, Qiuwen Zhang*, Jianfeng Zhu, Xiaofei Liu, Fei Yan
Abstract
Distribution center links the relief suppliers and affected people, making it an indispensable part in the transportation network of earthquake relief supplies. Therefore, the location of distribution center for earthquake relief supplies has significant influence on transportation cost, operation efficiency and logistics performance, which are important in reducing loss of lives and property.
In this paper, we first give a review of general facility location models and find out the traditional model most suitable to distribution center location for earthquake relief supplies. Then the special characteristics of relief supplies distribution center are analyzed in detail and a stochastic location model is proposed. The model is based on traditional P-median facility location model and stochastic road damage degree is introduced into the model being treated as a stochastic variable to better fit to actual situation. Monte Carlo simulation method is adopted to simulate the stochastic variable representing actual stochastic road damage situation after earthquake disasters to solve the model. At last, an illustrative example of Wenchuan earthquake is given to show the optimization process of the proposed model and verify the feasibility of the new model. Furthermore, solution comparison between the proposed method and traditional method is made to show the benefits of the new method introduced in our paper.
Article Information

Identifiers and Pagination:
Year: 2017Volume: 11
First Page: 24
Last Page: 35
Publisher Id: TOCSJ-11-24
DOI: 10.2174/1874110X01711010024
Article History:
Received Date: 30/08/2016Revision Received Date: 21/09/2016
Acceptance Date: 11/11/2016
Electronic publication date: 28/02/2017
Collection year: 2017
open-access license: This is an open access article distributed under the terms of the Creative Commons Attribution 4.0 International Public License (CC-BY 4.0), a copy of which is available at: https://creativecommons.org/licenses/by/4.0/legalcode. This license permits unrestricted use, distribution, and reproduction in any medium, provided the original author and source are credited.
* Address correspondence to this author at the School of Hydropower and Information Engineering, Huazhong University of Science and Technology. 1037 Luoyu Road, Wuhan, China; Tel: +86 15972970505; Email: qwzhang_hust@163.com
| Open Peer Review Details | |||
|---|---|---|---|
| Manuscript submitted on 30-08-2016 |
Original Manuscript | A Stochastic Distribution Center Location Model for Earthquake Relief Supplies Based on Monte Carlo Simulation | |
1. INTRODUCTION
Earthquake, which is one of the most catastrophic natural disasters, always brings great loss to people’s life and property. A tremendous 8.0 magnitude earthquake struck Sichuan, China, on May 12th, 2008, resulting in over 69000 deaths and more than136 billion economic losses in US Dollars. In the disastrous earthquake, about 461billion people were affected and urgently needed relief supplies to survive. This was followed by a severer earthquake in 9.0 magnitudes hitting eastern Japan, which even caused nuclear leakage in nuclear power station. The frequent occurrence of earthquake raises public concern on the issues of earthquake preparedness and promotes the ability of quick response to earthquakes, especially in the field of relief supplies transportation.
In the process of relief supplies transportation (Fig. 1), relief supplies from international aid, national disaster relief supplies warehouse, and nationwide donation are first gathered at collecting points, such as airports, railway stations and wharfs. These collecting points are usually treated as relief supplies suppliers. Then the relief supplies are transported from multiple suppliers to distribution centers, where the supplies are transferred, temporarily stored and redistributed. Finally, relief supplies are distributed to affected areas based on demand situations. As a key part of relief supplies transportation network, the location of distribution center is becoming one of the most important decision issues in disaster alleviation.
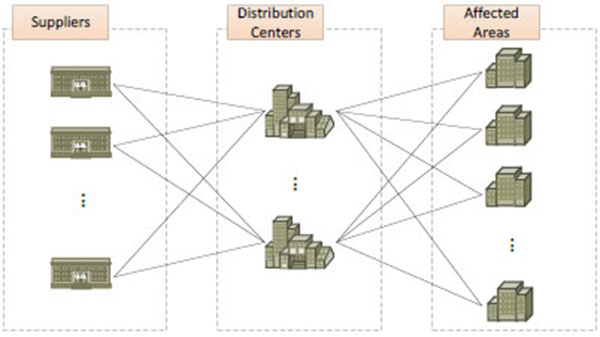 |
Fig. (1) Relief supplies transportation network. |
Distribution center location problems have been widely investigated for a long time. Li Feng et al. adopted a mix integer programming to distribution center location considering carbon emission [1F. Li, T. Liu, H. Zhang, R. Cao, W. Ding, and J.P. Fasano, "Distribution center location for green supply chain", Service Operat. Logist. Inform., vol. 2, pp. 2951-2956, 2008.]. Yang Lixing et al. proposed a chance-constrained programming model for distribution center location on the assumption that setup cost, turnover cost and demands of customers are fuzzy variables [2L. Yang, X. Ji, Z. Gao, and K. Li, "Logistics distribution centers location problem and algorithm under fuzzy environment", J. Comput. Appl. Math., vol. 208, no. 2, pp. 303-315, 2007.
[http://dx.doi.org/10.1016/j.cam.2006.09.015] ]. Sun Huijun et al. considered benefits of customers and logistics planning departments, and presented a bi-level programming model to seek the optimal location for logistics distribution centers [3H. Sun, Z. Gao, and J. Wu, "A bi-level programming model and solution algorithm for the location of logistics distribution centers", Appl. Math. Model., vol. 32, no. 4, pp. 610-616, 2008.
[http://dx.doi.org/10.1016/j.apm.2007.02.007] ]. Baohua Wang et al. proposed a robust optimization model using the formation of regret model to locate logistics center under uncertain environment [4W. Baohua, and H.E. Shiwei, "Robust optimization model and algorithm for logistics center location and allocation under uncertain environment", J. Transp. Syst. Eng. Inf. Technol., vol. 9, no. 2, pp. 69-74, 2009.
[http://dx.doi.org/10.1016/S1570-6672(08)60056-2] ]. Chen-Tung Chen put forward a new fuzzy multiple criteria decision-making method to deal with distribution center location selection problem [5C. Chen, "A fuzzy approach to select the location of the distribution center", Fuzzy Sets Syst., vol. 118, no. 1, pp. 65-73, 2001.
[http://dx.doi.org/10.1016/S0165-0114(98)00459-X] ]. Liu Sen et al. used a new hybrid heuristic algorithm combining rough set methods and fuzzy logic to deal with the determination of optimal distribution center location [6S. Liu, F.T. Chan, and S.H. Chung, "A study of distribution center location based on the rough sets and interactive multi-objective fuzzy decision theory", Robot. Comput.-Integr. Manuf., vol. 27, no. 2, pp. 426-433, 2011.
[http://dx.doi.org/10.1016/j.rcim.2010.09.003] ]. Li Ye et al. proposed a comprehensive methodology integrating AFS (Axiomatic Fuzzy Set) and TOPSIS (Technique for Order Preference by Similarity to an Ideal Solution) for region logistics center location [7Y. Li, X. Liu, and Y. Chen, "Selection of logistics center location using Axiomatic Fuzzy Set and TOPSIS methodology in logistics management", Expert Syst. Appl., vol. 38, no. 6, pp. 7901-7908, 2011.
[http://dx.doi.org/10.1016/j.eswa.2010.12.161] ].
Although these studies have provided many methods for distribution center location, the distribution center location problems for earthquake relief supplies are seldom mentioned. When an earthquake occurs, uncertainties exist in various aspects including uncertain relief materials supply, uncertain casualties, uncertain demand in affected areas and uncertain road damage. These uncertainties are important influencing factors and huge challenges for distribution center location problems, of which uncertain road damage is most intractable. Different degrees of road damage lead to different traffic capacities, which result in different traffic time afterwards. Since time is the major decision factor for earthquake relief supplies transportation optimization, road damage uncertainties should be highly valued and treated in a reasonable manner.
In this study, we mainly focus on the influence of uncertain road damage to distribution center location model and propose a stochastic earthquake relief supplies distribution center location model. The model is based on traditional P-median facility location model and stochastic road damage degree is introduced into the model being treated as a stochastic variable to better fit to actual situation. Monte Carlo simulation method is adopted to simulate the stochastic variable representing actual stochastic road damage situation after earthquake disasters to solve the model.
2. TRADITIONAL FACILITY LOCATION MODELS
Facility location models are analyzed to solve the problems where to locate a set of facilities to minimize or maximize the objective function subject to some constraints. The objective functions could be cost, profit, facility number, response time and so on. Based on the types of objective functions, the common traditional location models could be categorized into three kinds: covering models, P-median models and P-center models.
2.1. Covering Models, P-median Models and P-center Models
Covering models are the most widespread location models for locating emergency facilities. The objective of the covering models is to provide “coverage” to the demand points. The “coverage” is deemed as the service provided by facilities to demand points, and the distance between a demand point and the corresponding facility is less than a pre-set distance limit. In order to provide full coverage of all demand points, Toregas et al. first proposed the location set covering problem (LSCP) to minimize number of facilities needed [8C. Toregas, R. Swain, C. ReVelle, and L. Bergman, "The location of emergency service facilities", Oper. Res., vol. 19, no. 6, pp. 1363-1373, 1971.
[http://dx.doi.org/10.1287/opre.19.6.1363] ]. However, since full coverage is required in LSCP, the required facilities number may be larger than the actual available amount, resulting in an unreasonable situation. Aiming at this problem, Church and ReVelle [9R. Church, and C. Revelle, "The maximal covering location problem", Pap. Reg. Sci., vol. 32, no. 1, pp. 101-118, 1974.
[http://dx.doi.org/10.1007/BF01942293] ] and White and Case [10J.A. White, and K.E. Case, "On covering problems and the central facilities location problem", Geogr. Anal., vol. 6, no. 3, pp. 281-294, 1974.
[http://dx.doi.org/10.1111/j.1538-4632.1974.tb00513.x] ] develop the maximum covering location problem (MCLP), which does not require full coverage to all demand points. Instead, the model seeks to provide as much coverage as possible based on a given number of facilities.
Since LSCP aims to minimize the facility number and MCLP to maximize the coverage under limited facilities, they both take no consideration of service efficiency of transportation network. Service efficiency could be evaluated by the total distance between the demand points and selected facilities. A larger value of total distance indicates that the accessibility and effectiveness of facilities is worse. The P-median problem takes efficiency as an objective and seek to find a solution with the minimum total distance between demand points and facilities. So, the models are often applied in occasions where proximity is desirable, such as supermarkets, post offices, as well as emergency service facilities location. Dawson et al. used a hybrid method integrating P-median and P-center models to find locations with minimized travelling distance and minimized maximum distance between missile site and required security forces for the Minuteman Intercontinental Ballistic Missile (ICBM) nuclear weapon system [11M.C. Dawson, J.E. Bell, and J.D. Weir, "A hybrid location method for missile security team positioning", J. Business Manage., vol. 13, pp. 5-17, 2007.]. Serra et al. introduced classic scenario approach to solve uncertain demand and travel time in P-median problem when locating public facilities [12D. Serra, and V. Marianov, "The p-median problem in a changing network: The case of Barcelona", Location Sci., vol. 6, pp. 383-394, 1998.
[http://dx.doi.org/10.1016/S0966-8349(98)00049-7] ]. Afshartous et al. proposed a simulation-optimization methodology to address uncertain distress call in P-median model facing with US Coast Guard air station location problem [13D. Afshartous, Y. Guan, and A. Mehrotra, "US Coast Guard air station location with respect to distress calls: A spatial statistics and optimization based methodology", Eur. J. Oper. Res., vol. 196, no. 3, pp. 1086-1096, 2009.
[http://dx.doi.org/10.1016/j.ejor.2008.04.010] ]. Dantrakul et al. compared greedy algorithm based method, p-median method and p-center method when solving facility location problem where the objective function is to minimize total transportation and setup costs [14S. Dantrakul, C. Likasiri, and R. Pongvuthithum, "Applied p-median and p-center algorithms for facility location problems", Expert Syst. Appl., vol. 41, no. 8, pp. 3596-3604, 2014.
[http://dx.doi.org/10.1016/j.eswa.2013.11.046] ].
In contrast to P-median problem models, which concentrate on optimizing the overall performance of the whole system, the P-center model attempts to minimize the worst performance of the system, thus it is also known as minimax model. The P-center model considers that a demand point is served by its nearest facility and therefore full coverage to all demand points is always achieved.
2.1.1. Sets
S=the set of candidate distribution center (DC);
Sj=the jth candidate DC location, j=1,2,···,|S|;
D=the set of demand point (DP);
Di=the ith DP location, i=1,2,···,|D|.
2.1.2. Parameters
pi=the population at Di;
N=the number of DC;
dji=the distance between Sj and Di.
2.1.3. Decision Variables
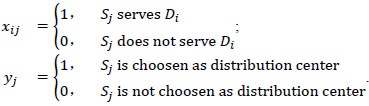
The formulation for the original P-median model is as follows:
 |
(1) |
 |
(2) |
 |
(3) |
 |
(4) |
 |
(5) |
 |
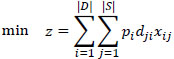
(6) |
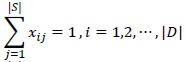
where Objective (1) is to minimize the total distance between DPs and DCs; Constraint (2) ensures that only the selected DCs could serve the DPs; Constraint (3) ensures that each DP is served by one and only one DC; Constraint (4) states that there are N DCs to be located at the candidate locations; finally, constraints (5) and (6) enforce the integrality of variables xij and yj.
3. THE PROPOSED MODELS
3.1. Road Damage Simulation
After earthquake disasters, the causes of road damage are multiple. According to the statistics and analysis results of historical seismic road damage data, 7 factors have great influence on road damage degree. They are seismic intensity (α1), roadbed soil type (α2), site classification (α3), subgrade failure (α4), roadbed type (α5), roadbed height difference (α6), seismic fortification intensity (α7). The categories of the 7 factors and corresponding quantized values are given in Table 1.
The 7 factors impact road damage at the same time, so road damage index (RDI) is proposed to reflect the integrated influence [15Y. Chen, and X. Chen, "An introduction to computer aid system for damage prediction of highway transportation system", Build. Sci., vol. 04, pp. 71-75, 1994. [In Chinese]., 16S. Jiang, and C. Liu, "Vulnerability analysis of transportation system in Sanya city", World Earthquake Eng., vol. 03, pp. 23-27, 2005. [In Chinese].]. The relationship between RDI and 7factors is:
 |
(7) |
Different values of RDI indicate different road damage degrees. The higher value of RDI represents severer seismic damage, and lower RDI declares slighter damage. The ranges of RDI and corresponding damage degrees are obtained according to analysis of historical data and given in Table 2.
Therefore, to obtain the damage degree of roads in seismic affected areas, the RDIs should be computed by the product of the 7 factors. However, the accurate value of these factors could not be acquired exactly in time after earthquake. Immediately after an earthquake disaster, α1 could be approximately obtained by spatial analysis of road net layer and estimated seismic intensity layer. α2, α3, α5, α6, α7 might be available through queries to traffic information database in some developed areas with perfect traffic informatization level, but they could not be easily got in every road at the range of a nation or all over the world. However α4 could only be accessed by field investigation which is a time-consuming work.
As a consequence, assuming α1 is deterministic and α2, α3, α5, α6, α7 are stochastic values obeying certain distributions, the values in Table 1 could be analyzed according to different values of seismic intensity (α1). The statistical results are shown in Table 3. The maxin, minin and meanin are the maximum, minimum and mean values of RDIin when α1=in.
The historical experience in earthquake disaster shows that RDIs under different seismic intensity degrees obey normal distribution RDIin~N(μin, σin2). According to the unique characteristics of normal distribution, the probability that the value of RDIin locates in the interval (-3σin+μin, μin+3σin) is 0.9973, and the probability beyond the interval is 0.0027, which is considered as small probability event (Fig. 2). So it could be assumed that the values of RDIin completely locate in (-3σin+μin, μin+3σin) and the relationships between maxin, minin, meanin and μin, σin are:
 |
(8) |
 |
(9) |
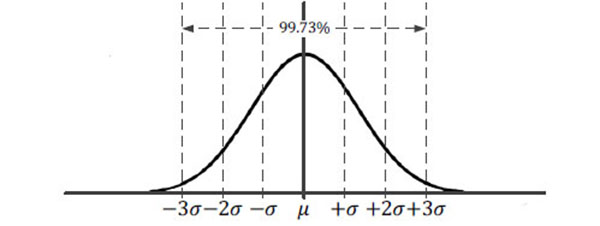 |
Fig. (2) The ±3σ+μ interval of normal distribution. |
The computational results of normal distributions parameters for RDIs in different seismic intensity degree areas are given in Table 4 and the corresponding probability density function graphs are shown in Fig. (3).
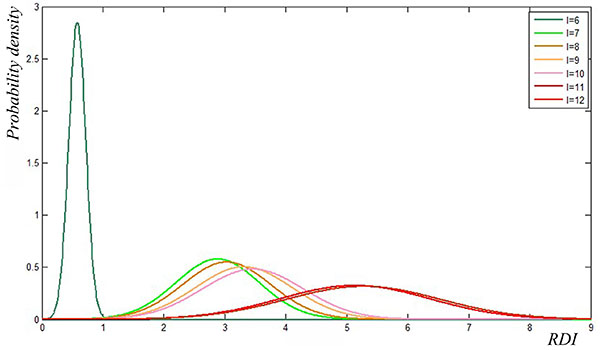 |
Fig. (3) The probability density function graphs for RDIs in different seismic intensity degree areas. |
3.2. Distance Penalty Coefficient
Since different RDIs reflect different road damage situations and higher value of RDI indicate severer damage, the traffic speed after seismic disaster would vary depending on road damage degrees, which is quantified as RDI. As a low value of RDI stands for slight road damage, the real traffic speed is close to designed traffic speed. However, when RDI is high, the road is severely damaged and the real traffic speed is much lower than the designed traffic speed.
In P-median model, the distance between facility and demand point is the only measurement in the objective. The value of distance is obtained under the condition that road is intact and real traffic speed is equal to design traffic speed. However, after earthquake disasters, roads are usually damaged in different degrees, thus leading to irrationality of original P-median model. So, improvements should be made to adjust P-median model to be suitable for facility location problems after earthquake disasters.
Because road damage would result in the decline of vehicle traffic speed, and lengthen traffic time as a result. So, an artificial increase of distance could offset the influence of speed decline being equivalent to the effect of road damage.
In this study, a distance penalty coefficient ξ is introduced to increase road distance, as an equivalent method to model the influence of road damage. Assuming the undamaged road distance is d, the following equations would be satisfied.
 |
(10) |
 |
(11) |
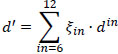
din is the road distance exposed i,so the sum of din is the total travel distance between a DP and a DC as illustrated in Fig. (4). d' is the equivalent distance with distance penalty coefficient considering road damage. ξin is the distance penalty coefficient suitable for road damaged in the area with seismic intensity degree in, and ξin should satisfy the constraint that the ξin in higher seismic intensity degree is larger than that in lower seismic intensity degree, represented as:
 |
(12) |
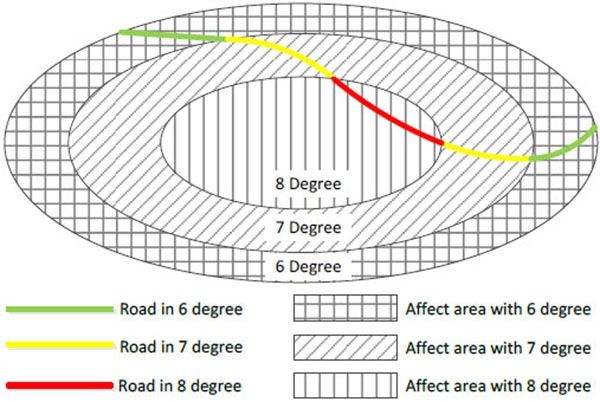 |
Fig. (4) Illustration of road sections located in different seismic intensity degree areas. |
3.3. Model Formulation
Considering road damage after earthquake, the original P-median facility location model needs to be modified to model the influence of road damage. Since road damage degree varies on seismic intensity degree, the road length in objective function should be divided into different sections according to the seismic intensity degree of area where road locates. Besides, the distance penalty coefficient should also be introduced to reflect the road damage influence to traffic speed. Thus, the objective function in the model should be modified as follows:
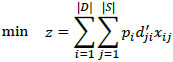 |
(13) |
where dji' is the sum of the modified road section distance which is the product of distance penalty coefficient and road section length, expressed as Equation (14).
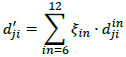 |
(14) |
The modified objective function (13) and (14), together with the constraints (2), (3), (4), (5), and (6), could be used to formulate the facility location problem for the distribution center location for earthquake relief supplies considering seismic damage to road.
3.4. Monte Carlo Simulation
Monte Carlo simulation is a method to obtain the expected value of a certain random variable by the estimation from the average of multiple independent samples representing the random variable. Since its simplicity and convenience, Monte Carlo simulation has been widely used to solve various engineering problems [17R.Y. Rubinstein, and D.P. Kroese, Simulation and the Monte Carlo method, John Wiley & Sons: New York, 2011., 18G.A. Bird, "Monte-Carlo simulation in an engineering context", Prog. Astronaut. Aeronaut., vol. 74, pp. 239-255, 1981.].
The basis of Monte Carlo method is the random sampling of variables from probability distributions [19C. Chou, "A combined MCDM and fuzzy MCDM approach to selecting the location of the distribution center in the hub port: an empirical study on Hong Kong, Shanghai and Kaohsiung", Int. J. Innov. Comput., Inf. Control, vol. 6, no. 7, pp. 3037-3051, 2010.]. For a random variable χ, its probability density function is p(χ), which defines the distribution of χ over the its value range (a,b).
In this study, the variable χ could be considered as the possible value of RDI which reflects road damage situation. In order to simulate road damage, the value for χ should be repeatedly and randomly sampled through a pseudo-random number generator provided by a computer. First, a random variable ξ, which is uniformly distributed over the interval (0,1), is generated. Then the variable χ is derived by solving Equation (15).
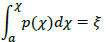 |
(15) |
Monte Carlo simulation offers a flexible, yet rigorous approach to simulate road damage situations after earthquake disasters. The method described road damage which is expressed as probability distributions that describe the RDIs in different seismic intensity areas. In a large-scale stochastic mathematical programming problem, the traditional method is almost impossible to obtain the correct solution, but Monte Carlo method could solve the problem with the help of computer. Monte Carlo method is statistical in nature and is expert in simulating actual situation by calculating at a large number of times (e.g. 10000 times) by computers.
4. NUMERICALS ANALYSIS
The main purpose of this numerical analysis is to demonstrate the potential applicability of the proposed model. The study case aims at the Wenchuan earthquake, which occurred in mid-western China on May 12, 2008. The seismic magnitude is 8.0 in Richter scale and the epicentral seismic intensity is 11 degree. The main affected region is located in Sichuan Province and others are located in Gansu and Shanxi Province, covering 22 counties as shown in Fig. (5). Therefore, the 22 counties are selected as study area in the following analysis of distribution center location.
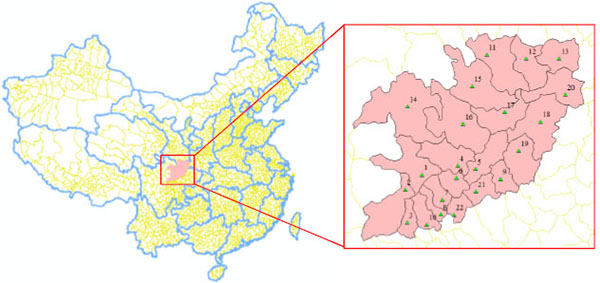 |
Fig. (5) The study area of this paper locates in mid-western China covering 22 counties. |
4.1. The Dataset
The populations of the 22 counties are obtained by spatial analysis in Geographic Information System (GIS) using Gridded Population of the World, Version 3 (GPWv3) provided by NASA Socioeconomic Data and Applications Center (SEDAC) [20"Center for International Earth Science Information Network", Columbia University. Gridded Population of the World, Version 3 (GPWv3): Population Count. Grid.. (Accessed May 1st, 2015).
[http://dx.doi.org/10.7927/H4639MPP ] ]. The population distribution pattern of the study area is shown in Fig. (6) and the precise numbers are given in Table 5.
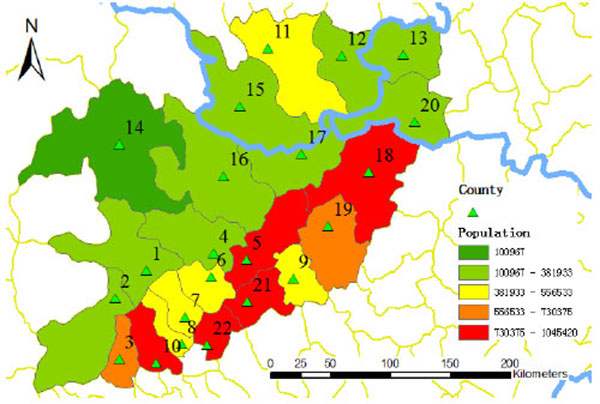 |
Fig. (6) The population distribution pattern in 22 counties. |
The road distances between any two counties of the 22 counties are calculated by network analysis in GIS using the nation-wide road network layer (Fig. 7). The analysis result is presented as a symmetric matrix composed of elements dpq(p,q=1,2,∙∙∙,22) whose value is given in Table 6. Furthermore, the lengths of road sections located in different seismic intensity degrees (dpqin) could be obtained through overlay analysis in GIS with the help of estimated seismic intensity map generated by the model proposed by Howell and Schultz [21B.F. Howell, and T.R. Schultz, "Attenuation of modified Mercalli intensity with distance from the epicenter", Bull. Seismol. Soc. Am., vol. 65, no. 3, pp. 651-665, 1975.] and modified by Dasheng Chen and Hanxing Liu [22D. Chen, and H. Liu, "Elliptical attenuation relationship of earthquake intensity", North China Earthquake Sci., vol. 7, no. 3, pp. 31-42, 1989.]. The value amount of dpqin(in=7,8,∙∙∙,11) is large and not given in detail in this paper.
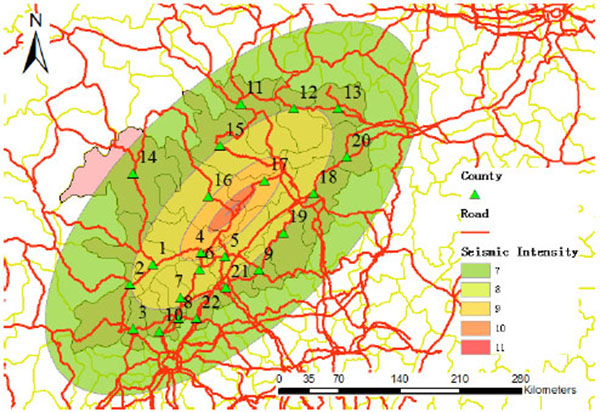 |
Fig. (7) Overlay analysis between road network and estimated seismic intensity map. |
The distance penalty coefficient is highly related with RDIin and it also complies with normal distribution. The normal distribution parameters in each seismic intensity degree area are analyzed and decided by experts. In the study area covering 22 counties, the roads are mainly located in the areas with seismic intensity degrees from 7 degree to 11 degree, so the parameters of are given in Table 7.

4.2. Computational Results
Based on the input parameters specified in the above dataset, we solve the facility location problem for distribution center on the MATLAB R2012b platform. Besides, the deterministic model is also built and the parameters are given as the expectations of the stochastic parameters.
The computational results in Table 8 show that the objective values of deterministic model and the proposed stochastic model are almost the same, however, the solution sets between two models are not different. In the deterministic model, the road damage situation is set to be a known and explicit parameter, so the locations of DCs are optimally determined as county 1, 4, 8, 11 and 18, more visually indicated in the map in Fig. (8a). Since the stochastic model simulate the uncertain road damage which is similar to the actual situation, three solution sets are obtained through the repeated sampling of road damage in different seismic intensity degrees. The locations of DCs are varying among the following three solutions: (1) county 1, 4, 8, 11, 18; (2) county 1, 5, 8, 11, 18; (3) county 2, 5, 8, 11, 18 (Figs. 8b, c, d). The solutions are chosen according to the actual road situation after earthquake disaster. However, the pattern of probabilities of the above three solutions could be found through the iterations of model optimization. The probabilities of solutions are P1=0.51 for solution (1), P2=0.47 for solution (2), P3=0.02 for solution (3), indicating that solution (1) and (2) are generally adopted in most simulated road damage situations but solution (3) is just suitable for the extreme cases which rarely occurs in the simulations.
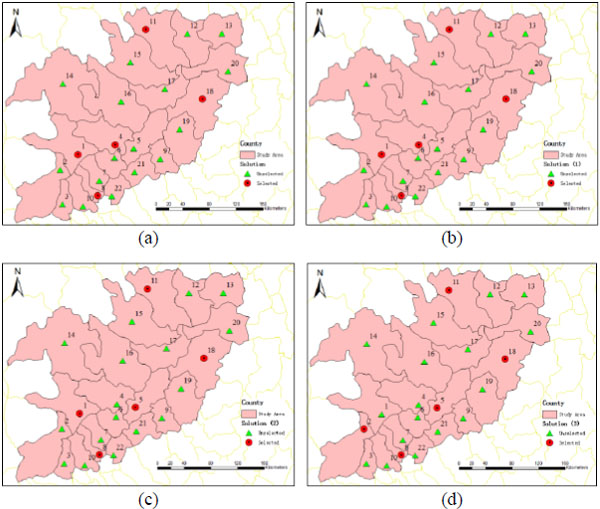 |
Fig. (8) The solutions of numerical analysis: (a) the solution for the deterministic model; (b), (c), (d) the solutions for the stochastic model. |
The deterministic model provides only one solution of DCs locations on the assumption that the road damage situations in different seismic intensity degrees are strictly equal to the expectations of the stochastic distributions. We have to admit that the model indeed give a location solution of DCs, however, the solution may not be suitable to all the road damage situations. The stochastic model has the advantage over the deterministic one for the more comprehensive and complete solution covering more situations, thus makes it possible to provide alternative solutions for decisions makers.
CONCLUSION
This paper has proposed a distribution center location model for earthquake relief supplies using Monte Carlo method to simulate the stochastic road damage, enhancing its adaptability to actual situation. In order to quantify the road damage in seismic disaster, road damage index has been analyzed according to seismic intensity degree. In addition, distance penalty coefficient has been also integrated into the model to establish a relationship between road damage index and the widely-used P-median location model. Furthermore, we have modified the traditional P-median model to put in the influence of vehicle travel time delay because of road damage. At last, a numerical analysis focusing on 22 counties after Wenchuan earthquake has been carried out to illustrate and verify the proposed model. The results have shown that the new location method take careful consideration on the road damage influence, so the solutions are more reasonable and better fit to the actual situation. Besides, more than one solution has been produced by the new method, so it could provide more useful and comprehensive information when important decisions are made.
CONFLICT OF INTEREST
The authors confirm that this article content has no conflict of interest.
ACKNOWLEDGEMENTS
This study is supported by the Natural Science Foundation of Hubei Province in China (2015CFA134) and the National Natural Science Foundation of China (41072199). Thanks are due to China Academy of Building Research for providing the historical road damage data which is important for our research.
REFERENCES
| [1] | F. Li, T. Liu, H. Zhang, R. Cao, W. Ding, and J.P. Fasano, "Distribution center location for green supply chain", Service Operat. Logist. Inform., vol. 2, pp. 2951-2956, 2008. |
| [2] | L. Yang, X. Ji, Z. Gao, and K. Li, "Logistics distribution centers location problem and algorithm under fuzzy environment", J. Comput. Appl. Math., vol. 208, no. 2, pp. 303-315, 2007. [http://dx.doi.org/10.1016/j.cam.2006.09.015] |
| [3] | H. Sun, Z. Gao, and J. Wu, "A bi-level programming model and solution algorithm for the location of logistics distribution centers", Appl. Math. Model., vol. 32, no. 4, pp. 610-616, 2008. [http://dx.doi.org/10.1016/j.apm.2007.02.007] |
| [4] | W. Baohua, and H.E. Shiwei, "Robust optimization model and algorithm for logistics center location and allocation under uncertain environment", J. Transp. Syst. Eng. Inf. Technol., vol. 9, no. 2, pp. 69-74, 2009. [http://dx.doi.org/10.1016/S1570-6672(08)60056-2] |
| [5] | C. Chen, "A fuzzy approach to select the location of the distribution center", Fuzzy Sets Syst., vol. 118, no. 1, pp. 65-73, 2001. [http://dx.doi.org/10.1016/S0165-0114(98)00459-X] |
| [6] | S. Liu, F.T. Chan, and S.H. Chung, "A study of distribution center location based on the rough sets and interactive multi-objective fuzzy decision theory", Robot. Comput.-Integr. Manuf., vol. 27, no. 2, pp. 426-433, 2011. [http://dx.doi.org/10.1016/j.rcim.2010.09.003] |
| [7] | Y. Li, X. Liu, and Y. Chen, "Selection of logistics center location using Axiomatic Fuzzy Set and TOPSIS methodology in logistics management", Expert Syst. Appl., vol. 38, no. 6, pp. 7901-7908, 2011. [http://dx.doi.org/10.1016/j.eswa.2010.12.161] |
| [8] | C. Toregas, R. Swain, C. ReVelle, and L. Bergman, "The location of emergency service facilities", Oper. Res., vol. 19, no. 6, pp. 1363-1373, 1971. [http://dx.doi.org/10.1287/opre.19.6.1363] |
| [9] | R. Church, and C. Revelle, "The maximal covering location problem", Pap. Reg. Sci., vol. 32, no. 1, pp. 101-118, 1974. [http://dx.doi.org/10.1007/BF01942293] |
| [10] | J.A. White, and K.E. Case, "On covering problems and the central facilities location problem", Geogr. Anal., vol. 6, no. 3, pp. 281-294, 1974. [http://dx.doi.org/10.1111/j.1538-4632.1974.tb00513.x] |
| [11] | M.C. Dawson, J.E. Bell, and J.D. Weir, "A hybrid location method for missile security team positioning", J. Business Manage., vol. 13, pp. 5-17, 2007. |
| [12] | D. Serra, and V. Marianov, "The p-median problem in a changing network: The case of Barcelona", Location Sci., vol. 6, pp. 383-394, 1998. [http://dx.doi.org/10.1016/S0966-8349(98)00049-7] |
| [13] | D. Afshartous, Y. Guan, and A. Mehrotra, "US Coast Guard air station location with respect to distress calls: A spatial statistics and optimization based methodology", Eur. J. Oper. Res., vol. 196, no. 3, pp. 1086-1096, 2009. [http://dx.doi.org/10.1016/j.ejor.2008.04.010] |
| [14] | S. Dantrakul, C. Likasiri, and R. Pongvuthithum, "Applied p-median and p-center algorithms for facility location problems", Expert Syst. Appl., vol. 41, no. 8, pp. 3596-3604, 2014. [http://dx.doi.org/10.1016/j.eswa.2013.11.046] |
| [15] | Y. Chen, and X. Chen, "An introduction to computer aid system for damage prediction of highway transportation system", Build. Sci., vol. 04, pp. 71-75, 1994. [In Chinese]. |
| [16] | S. Jiang, and C. Liu, "Vulnerability analysis of transportation system in Sanya city", World Earthquake Eng., vol. 03, pp. 23-27, 2005. [In Chinese]. |
| [17] | R.Y. Rubinstein, and D.P. Kroese, Simulation and the Monte Carlo method, John Wiley & Sons: New York, 2011. |
| [18] | G.A. Bird, "Monte-Carlo simulation in an engineering context", Prog. Astronaut. Aeronaut., vol. 74, pp. 239-255, 1981. |
| [19] | C. Chou, "A combined MCDM and fuzzy MCDM approach to selecting the location of the distribution center in the hub port: an empirical study on Hong Kong, Shanghai and Kaohsiung", Int. J. Innov. Comput., Inf. Control, vol. 6, no. 7, pp. 3037-3051, 2010. |
| [20] | "Center for International Earth Science Information Network", Columbia University. Gridded Population of the World, Version 3 (GPWv3): Population Count. Grid.. (Accessed May 1st, 2015). [http://dx.doi.org/10.7927/H4639MPP ] |
| [21] | B.F. Howell, and T.R. Schultz, "Attenuation of modified Mercalli intensity with distance from the epicenter", Bull. Seismol. Soc. Am., vol. 65, no. 3, pp. 651-665, 1975. |
| [22] | D. Chen, and H. Liu, "Elliptical attenuation relationship of earthquake intensity", North China Earthquake Sci., vol. 7, no. 3, pp. 31-42, 1989. |