- Home
- About Journals
-
Information for Authors/ReviewersEditorial Policies
Publication Fee
Publication Cycle - Process Flowchart
Online Manuscript Submission and Tracking System
Publishing Ethics and Rectitude
Authorship
Author Benefits
Reviewer Guidelines
Guest Editor Guidelines
Peer Review Workflow
Quick Track Option
Copyediting Services
Bentham Open Membership
Bentham Open Advisory Board
Archiving Policies
Fabricating and Stating False Information
Post Publication Discussions and Corrections
Editorial Management
Advertise With Us
Funding Agencies
Rate List
Kudos
General FAQs
Special Fee Waivers and Discounts
- Contact
- Help
- About Us
- Search


The Open Cybernetics & Systemics Journal
(Discontinued)
ISSN: 1874-110X ― Volume 12, 2018
Analysis of Chinese Stock Market by Using the Method of Visibility Graph
Fuyu Liu1, NIingkui Wang1, Daijun Wei1, 2, 3, *
Abstract
Many researchers studied the complexity of financial markets based on complex networks methods. The conversion of financial markets into complex networks is an open issue. In this paper, the data of 2571 stock companies in 2012 and the data of 2578 stock companies in 2013 are collected from Chinese stock market. Every year, data of these stock companies are randomly arranged. These data are then converted into some complex networks based on the visibility graph method. For these complex networks, degree distribution and clustering coefficient are considered. Our results show that the complex networks have the power-law distribution and small-world properties. The Pareto principle is also testified by the rank of average degree of companies in Chinese stock.
Article Information

Identifiers and Pagination:
Year: 2017Volume: 11
First Page: 36
Last Page: 43
Publisher Id: TOCSJ-11-36
DOI: 10.2174/1874110X01711010036
Article History:
Received Date: 25/05/2016Revision Received Date: 18/08/2016
Acceptance Date: 27/09/2016
Electronic publication date: 28/02/2017
Collection year: 2017
open-access license: This is an open access article distributed under the terms of the Creative Commons Attribution 4.0 International Public License (CC-BY 4.0), a copy of which is available at: https://creativecommons.org/licenses/by/4.0/legalcode. This license permits unrestricted use, distribution, and reproduction in any medium, provided the original author and source are credited.
* Address correspondence to this author at the School of Science, Hubei University for Nationalities, Enshi, Hubei, 445000, China; Tel: +8613517170418; E-mails: prof.wei@hotmail.com, eswdj@163.com
| Open Peer Review Details | |||
|---|---|---|---|
| Manuscript submitted on 25-05-2016 |
Original Manuscript | Analysis of Chinese Stock Market by Using the Method of Visibility Graph | |
1. INTRODUCTION
Recently, complex networks have attracted much attention since many structure and properties of real complex systems in natural sciences field that can be described by complex networks [1-10] . The financial market is a typical complex system since it has many complexity factors [11-13]. Consequently, the complex networks are a useful tool to research the complexity of financial markets [14-21]. However, how to convert the complexity of financial markets into a theoretical model of complex networks is still an open issue in the study. Namiki et al. [22] built the complex networks using the threshold method. Tabak et al. [23] built the minimum spanning tree for researching Brazil stock market and Brazil fund finance. Cai Shimin et al. [24] obtained the grid structure of the financial market based on empirical research. Recently, Chinese stock market has been considered by many researchers. For examples, Yao et al. [25] studied the difference on herding behavior between A and B of Chinese markets. The relationship between Chinese stock market and surrounding stock markets has been studied by Feng et al. [26]. The asymmetric multifractal scaling behavior and forecasting volatility of Chinese stock market are revealed by using asymmetric multifractal detrended fluctuation analysis method and the Heterogeneous Autoregressive with Continuous volatility and Jumps model, respectively [27, 28].
The visibility algorithm is an efficient and intuitional approach to convert the time series into a graph, which is denoted by a visibility graph [29]. The visibility graph is used to reveal the properties of different types of time series [30-34]. Firstly, in the visibility algorithm, the values of a time series are represented by the height of vertical bars. The higher the value of vertical bars, the higher will be the value of time series. Secondly, these vertical bars are regarded as landscapes, and every bar is linked with other that can be seen from the top of the considered one [35] Lastly, every bar and link is denoted as a node and edge, respectively. The time series is described by networks. Specifically, some time series of the financial market are also indicated by visibility graph, such as quarterly macroeconomic series of China [36] and gold price time series [37]. In this paper, Chinese stock market is considered on the basis of visibility graph method. The data is collected from 2571 Chinese stock companies in 2012 and 2578 of that in 2013. For data of each year, four sequences are obtained after data of these stock companies are randomly arranged on four times. And then, every sequence is converted into complex networks based on the visibility algorithm. Eight complex networks are obtained for two years. The degree distribution and clustering coefficient of these complex networks are calculated. Some properties of Chinese stock market are also revealed.
The remainder of this paper is organized as follows: Section 2 briefly introduces the complex networks and visibility graph. The method of stock network based on visibility graph is proposed in Section 3. An illustrative numerical example for Chinese stock market is described in Section 4. Conclusion on the outcomes of the analysis is drawn in Section 5.
2. PRELIMINARIES
2.1. Degree Distribution of Complex Networks
The degree of node is a basic parameter to describe the local characteristics of the network, degree of node i is denoted as Ki. It is defined as follows [38]:
 |
(1) |
where n is the total number of node, Xij and is defined as 1 if node i is connected to node j, and 0 otherwise. i is the focal node, j shows all other nodes.
From complex networks, probability of degree distribution of node with degree K is denoted as PK and defined as follows:
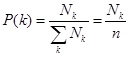 |
(2) |
where Nk is the number of nodes with degree k. For average degree
 , we have:
 |
For random network, its degree distribution is as follows [38L.C. Freeman, "Centrality in social networks conceptual clarification", Soc. Networks, vol. 1, no. 3, pp. 215-239, 2012.
[http://dx.doi.org/10.1016/0378-8733(78)90021-7] ]:
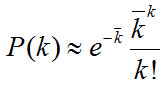 |
However, degree distribution of scale-free network is as follows [39A. L. Barabási, R. Albert, and H. Jeong, "Mean-field theory for scale-free random networks", Physica A:, vol. 272, no. 1-2, pp. 173-187, 1999.]:
 |
2.2. Clustering Coefficient and Average Path Length of Complex Networks
The small-world networks have the higher clustering coefficient and shorter average path length. For given node i, its clustering coefficient Ci is the probability of the connection between any two points connected with node i. It is defined as follows [5]:
 |
(3) |
where Ei represents the number of edges of connected neighboring nodes i.
The average coefficients C is defined as follows:
 |
(4) |
For fully-connected network, the value of C = 1. For scale-free network, the value of average coefficients is close to 1.
For unweighted complex networks, denoting lij as path length of between node i and node j, which satisfies:
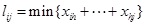 |
(5) |
The average path length of complex unweighted networks is given as follows:
 |
(6) |
2.3. The Visibility Graph
In order to characterize time series from associated network topology, the visibility graph method was first proposed by L. Lacasa et al. in 2008 [29]. In the visibility graph method, the values of time series are plotted using vertical bars. A vertical bar links with others which can be seen from the top of itself. The visibility criterion is established in the literature as follows:
Definition 2.1 Two arbitrary data values (t1, y1) and (t2, y2) have visibility, and consequently they become two connected nodes of the associated graph [29], if any other data (t3, y3) placed between them fills the requirement:
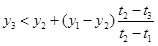 |
As shown in Fig. (1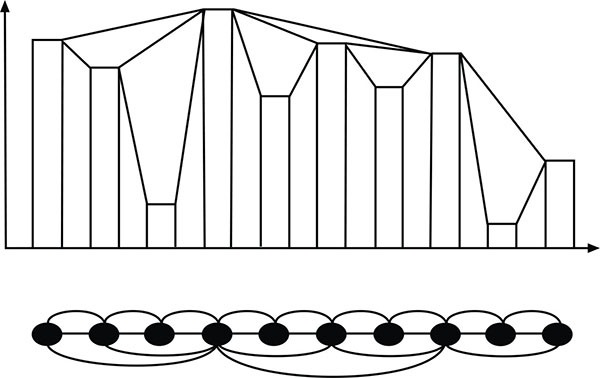 ), the histogram shows a time series with 11 data values, and the associated graph is obtained according to the visibility algorithm. In the histogram, if a bar can be observed from the top of considered one, it will found to be linked. If two bars are linked in the histogram, the vertices which represent them will be linked in the associated graph.
 |
Fig. (1) The visibility graph. |
The associated graph extracted from a time series is follows:
- Connected: Each node sees at least its nearest neighbors.
- Undirected: The associated graph extracted from a time series is undirected.
- Invariant under affine transformations of the series data: the visibility criterion is invariant, when horizontal and vertical axes are rescaled.
3. THE METHOD OF STOCK NETWORK BASED ON VISIBILITY GRAPH
Extraction of stock network from the stock market is an important task. The stock market is described as time series by many researchers [40-42]. However, they usually considered income of a stock company in a specific time period or in a trading day. These references do not portray the situation of stock companies of other nations. In this paper, all stock companies of other nations are considered and modeled as stock networks. The main steps of modeling are as follows:
- Step 1: The values of closing price of all stock companies are collected through software of stock.
- Step 2: The closing price of each stock company is described as a vertical bar. The value of close price is represented by height of vertical bar. The bigger the value is the higher the bar will be.
- Step 3: For each year, data of these vertical bars are arranged randomly.
- Step 4: Two vertical bars are joined by a straight line, if their direct linking is not crossing the other bars.
- Step 5: These vertical bars and joints are represented by nodes and edges of network, respectively.
According to the above five steps, a stock network is obtained. For each year, data of these vertical bars are randomly arranged a number of times. For each time, the range can be converted into complex networks based on the visibility graph method.
4. APPLICATION OF CHINESE STOCK MARKET
4.1. The Visibility Graph and Some Measures of Complex Networks
The application of complex networks in Chinese stock market is considered in this section. The basic data is the year-end closing price of all public companies in China, taken from the year 2012-2013 of Chinese stock market. The date derived from Straight flush, an online stock trading securities analysis software. According to the proposed method, every year, the data of these vertical bars are arranged randomly four times. And then, four stock networks are obtained and denoted as and, where is shows the times of random permutation. The four complex networks of 2012 and 2013 are shown in Figs. (2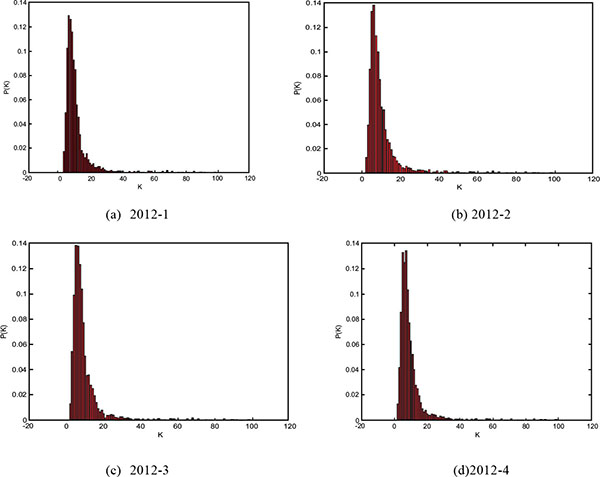 and 3
and 3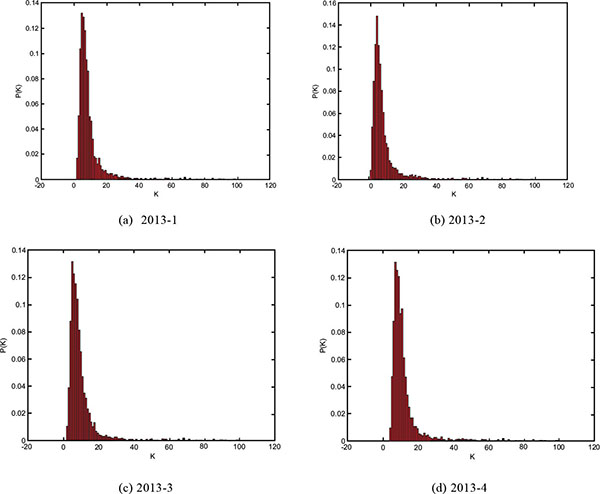 ) respectively. The degree distribution and clustering coefficient of these complex networks are shown in Table 1.
From Table 1, the values of are always between 10 and 11, the values of are always less than 4 and the values of are always around 0.83. The values of average path length of these complex networks are small and the values of clustering coefficient are big, although these networks have a great number of nodes. From Figs. (2 and 3), the degree distribution is fitting with, the values of in these complex networks are approximate 3.5.
 |
Fig. (2) The degree distribution in 2012. |
 |
Fig. (3) The degree distribution in 2013. |
The average degree of every company is calculated each year, and then the companies are sorted from high to low according to the value of average degree. The companies ranking in top 10 of every year are shown in Table 2. Table 2 shows that these companies are always banks and oil companies.
4.2. Analysis of Chinese Stock Market
From previous section, although the number of companies is more than 2000, the average degree and the average shortest length of these complex networks are always about 10 and 4, respectively. The values of average degree in top 10 companies are always more than 95. Indeed, the No.1, The Industrial and Commercial Bank of China is 648.75 in 2013. In these complex networks, there are few Hob nodes, such as “The Industrial and Commercial Bank of China”, “The Agricultural Bank of China” and “Bank of China”. Meanwhile, from Figs. (2 and 3), the stock-market networks of Chinese stock market show scale-free property. From Table 2, ranking with average degree of companies, there are almost state holding pattern companies in the top 10 list.The result described that public sector of the economy is very important in the Chinese stock market.
Another interesting result here is that the verification of the Pareto principle. As per the ranking of average degree of company, the sum of 20 percent of companies having general income is 81.16% and 80.05% in 2012 and 2013, respectively. It reflects a market phenomenon that minority companies are occupied numerous markets. The result described the disequilibrium of income of every company in the Chinese stock market. Moreover, these stock networks follow the power-law distribution, which also explains these networks fit in the Pareto Principle. For Chinese stock market in 2012 and 2013, the Pareto Principle and the scale-free property are found to be consistent.
CONCLUSION
Complex networks have been applied for researching financial markets. There are many methods to convert the financial markets into complex networks. In this paper, the visibility graph method is used to describe the Chinese stock market. The basic data is the year-end closing price of all public companies in China, ranging from 2012-2013 Chinese stock market. Based on visibility graph method, complex networks are obtained. And then, some measures of complex networks are studied. Our results revealed that the stock networks have the power-law distribution and small-world properties. Indeed, the Pareto principle is also found in Chinese stock market using our method. The numerical examples show that the proposed approach can reveal the stock market. The proposed method not only extends the application of the visibility graph but also enriches the studying of Chinese stock market.
CONFLICT OF INTEREST
The authors confirm that this article content has no conflict of interest.
ACKNOWLEDGEMENTS
The authors’ all are grateful to Miss Sijing Wei at the Hong Kong Baptist University for a number of discussions, and Phd N. Paromita at the Vanderbilt University for her help for language assistance in writing this paper. The work is partially supported by Foundation of Educational Commission of Hubei Province of China (Grant No.D20151902), the Training Programs of Innovation and Entrepreneurship for Undergraduates of Hubei Province (Grant No.201410517018).
REFERENCES
| [1] | A. Arxiden, S. Wang, and H. Deng, "Logical analysis of complex network searching", Open Cybern. Syst. J., vol. 9, no. 1, pp. 2681-2687, 2015. [http://dx.doi.org/10.2174/1874110X01509012681] |
| [2] | M. Girvan, and M.E. Newman, "Community structure in social and biological networks", Proc. Natl. Acad. Sci. USA, vol. 99, no. 12, pp. 7821-7826, 2002. [http://dx.doi.org/10.1073/pnas.122653799] [PMID: 12060727] |
| [3] | H. Liu, J.A. Lu, J. Lü, and D.J. Hill, "Structure identification of uncertain general complex dynamical networks with time delay", Automatica, vol. 45, no. 8, pp. 1799-1807, 2009. [http://dx.doi.org/10.1016/j.automatica.2009.03.022] |
| [4] | M. Vidal, M.E. Cusick, and A.L. Barabási, "Interactome networks and human disease", Cell, vol. 144, no. 6, pp. 986-998, 2011. [http://dx.doi.org/10.1016/j.cell.2011.02.016] [PMID: 21414488] |
| [5] | D.J. Watts, and S.H. Strogatz, "Collective dynamics of small-world networks", Nature, vol. 393, no. 6684, pp. 440-442, 1998. [http://dx.doi.org/10.1038/30918] [PMID: 9623998] |
| [6] | D. Wei, X. Deng, X. Zhang, Y. Deng, and S. Mahadevan, "Identifying influential nodes in weighted networks based on evidence theory", Physica A:, vol. 392, no. 10, pp. 2564-2575, 2013. |
| [7] | D. Wei, B. Wei, H. Zhang, C. Gao, and Y. Deng, "A generalized volume dimension of complex networks", J. Stat. Mech., vol. 2014, no. 10, 2014. |
| [8] | D.J. Wei, Q. Liu, H.X. Zhang, Y. Hu, Y. Deng, and S. Mahadevan, "Box-covering algorithm for fractal dimension of weighted networks", Sci. Rep., vol. 3, no. 6157, pp. 3049-3049, 2013. [PMID: 24157896] |
| [9] | Z. Wu, and X. Fu, "Cluster mixed synchronization via pinning control and adaptive coupling strength in community networks with nonidentical nodes", Commun. Nonlinear Sci. Numer. Simul., vol. 17, no. 4, pp. 1628-1636, 2012. [http://dx.doi.org/10.1016/j.cnsns.2011.09.012] |
| [10] | W. Liu, C. Liu, Z. Yang, X. Liu, Y. Zhang, and Z. Wei, "Modeling the propagation of mobile malware on complex networks", Commun. Nonlinear Sci. Numer. Simul., vol. 37, pp. 249-264, 2016. [http://dx.doi.org/10.1016/j.cnsns.2016.01.019] |
| [11] | G. Caldarelli, S. Battiston, D. Garlaschelli, and M. Catanzaro, "Emergence of complexity in financial networks", In: E. Ben-Naim, H. Frauenfelder, and Z. Toroczkai, Eds., Lecture Notes in Physics, vol. 650. Springer: Berlin Heidlberg, 2004, pp. 399-423. |
| [12] | C. Du, X. Wang, and L. Qiu, "Block & comovement effect of stock market in financial complex network", Lecture Notes Inst. Comput. Sci. Social Inform. Telecommun. Eng., vol. 5, pp. 1248-1260, 2009. [http://dx.doi.org/10.1007/978-3-642-02469-6_6] |
| [13] | D.Y. Kenett, T. Preis, G. GurGershgoren, and E. BenJacob, "Dependency network and node influence: Application to the study of financial markets", Int. J. Bifurcat. Chaos, vol. 22, no. 7, pp. 1265-1336, 2012. [http://dx.doi.org/10.1142/S0218127412501817] |
| [14] | S. Bougheas, and A. Kirman, Complex financial networks and systemic risk: A review, Springer International Publishing: Switzerland, 2015, pp. 115-139. [http://dx.doi.org/10.1007/978-3-319-12805-4_6] |
| [15] | A. Krawiecki, "Microscopic spin model for the stock market with attractor bubbling on scale-free networks", J. Econ. Interac. Coord., vol. 4, no. 2, pp. 213-220, 2009. [http://dx.doi.org/10.1007/s11403-009-0055-9] |
| [16] | W.S. Lan, and S.D. Zhang, "Research of strong correlation of stocks based complex networks in real estate sector in China stock markets", Math. Pract. Theory, vol. 39, no. 4, pp. 62-67, 2009. |
| [17] | K.E. Lee, J.W. Lee, and B.H. Hong, "Complex networks in a stock market", Comput. Phys. Commun., vol. 177, no. 1, p. 186, 2007. [http://dx.doi.org/10.1016/j.cpc.2007.02.047] |
| [18] | X. Li, "Research on financial risk management based on VAR model", Open Cybern. Syst. J., vol. 9, no. 1, pp. 1849-1852, 2015. [http://dx.doi.org/10.2174/1874110X01509011849] |
| [19] | J.P. Onnela, "Complex networks in the study of financial and social systems", Phd Thesis, Helsinki University of Technology, Finland, 2006. |
| [20] | T. Roukny, H. Bersini, H. Pirotte, G. Caldarelli, and S. Battiston, "Default cascades in complex networks: topology and systemic risk", Sci. Rep., vol. 3, no. 7468, pp. 2759-2759, 2013. [PMID: 24067913] |
| [21] | T. Suzuki, T. Ikeguchi, and Y. Horio, "Estimating structures of complex networks hidden in nikkei 225 stock market", Ieice Tech. Rep. Nonlinear Probl., vol. 105, no. 547, pp. 135-140, 2006. |
| [22] | A. Namaki, A. H. Shirazi, R. Raei, and G. R. Jafari, "Network analysis of a financial market based on genuine correlation and threshold method", Physica A:, vol. 390, no. (21-22), pp. 3835-3841, 2011. |
| [23] | B. M. Tabak, T. R. Serra, and D. O. Cajueiro, "Topological properties of stock market networks: The case of Brazil", Physica A:, vol. 389, no. 389, pp. 3240-3249, 2010. |
| [24] | S.M. Cai, L. Hong, F.U. Zhong-Qian, and P.L. Zhou, "Empirical study on network structure of financial market based on complex network theory", Complex Syst. Complex. Sci., vol. 10, no. 5, pp. 1099-1103, 2011. |
| [25] | J. Yao, C. Ma, and W.P. He, "Investor herding behaviour of Chinese stock market", Int. Rev. Econ. Finance, vol. 29, no. 1, pp. 12-29, 2014. [http://dx.doi.org/10.1016/j.iref.2013.03.002] |
| [26] | F. Ma, Y. Wei, and D. Huang, "Multifractal detrended cross-correlation analysis between the Chinese stock market and surrounding stock markets", Physica A:, vol. 392, no. 7, pp. 1659-1670, 2013. |
| [27] | G. Cao, J. Cao, and L. Xu, "Asymmetric multifractal scaling behavior in the Chinese stock market: Based on asymmetric MF-DFA", Physica A:, vol. 392, no. 4, pp. 797-807, 2013. |
| [28] | C. Huang, X. Gong, X. Chen, and F. Wen, "Measuring and forecasting volatility in chinese stock market using HAR-CJ-M model", Abstr. Appl. Anal., vol. 2013, no. 1, pp. 103-128, 2013. |
| [29] | L. Lacasa, B. Luque, F. Ballesteros, J. Luque, and J.C. Nuño, "From time series to complex networks: the visibility graph", Proc. Natl. Acad. Sci. USA, vol. 105, no. 13, pp. 4972-4975, 2008. [http://dx.doi.org/10.1073/pnas.0709247105] [PMID: 18362361] |
| [30] | M. Ahmadlou, and H. Adeli, "Visibility graph similarity: A new measure of generalized synchronization in coupled dynamic systems", Physica D., vol. 241, no. 4, pp. 326-332, 2012. [http://dx.doi.org/10.1016/j.physd.2011.09.008] |
| [31] | B. Luque, L. Lacasa, F. Ballesteros, and J. Luque, "Horizontal visibility graphs: exact results for random time series", Phys. Rev. E Stat. Nonlin. Soft Matter Phys., vol. 80, no. 4 Pt 2, p. 046103, 2009. [http://dx.doi.org/10.1103/PhysRevE.80.046103] [PMID: 19905386] |
| [32] | L. Telesca, M. Lovallo, S.K. Aggarwal, P.K. Khan, and B.K. Rastogi, "Visibility graph analysis of the 2003–2012 earthquake sequence in the Kachchh Region of Western India", Pure Appl. Geophys., vol. 173, no. 1, pp. 125-135, 2016. |
| [33] | T.T. Zhou, "Limited penetrable visibility graph for establishing complex network from time series", Wuli Xuebao, vol. 61, no. 3, pp. 355-367, 2012. |
| [34] | H. Wang, H. Mo, R. Sadiq, Y. Hu, and Y. Deng, "Ordered visibility graph weighted averaging aggregation operator: A methodology based on network analysis", Comput. Ind. Eng., vol. 88, no. C, pp. 181-190, 2015. [http://dx.doi.org/10.1016/j.cie.2015.06.021] |
| [35] | N. Wang, and D. Wei, "From View of Complex Network: Fractal Dimension of Music Notation", In: Control and Decision Conference (2014 CCDC), The 26th Chinese, IEEE: China, 2014, pp. 3647-3650. [http://dx.doi.org/10.1109/CCDC.2014.6852813] |
| [36] | N. Wang, D. Li, and Q. Wang, "Visibility graph analysis on quarterly macroeconomic series of China based on complex network theory", Physica A:, vol. 391, no. 24, pp. 6543-6555, 2012. |
| [37] | Y. Long, "Visibility graph network analysis of gold price time series", Physica A:, vol. 392, no. 16, pp. 3374-3384, 2013. |
| [38] | L.C. Freeman, "Centrality in social networks conceptual clarification", Soc. Networks, vol. 1, no. 3, pp. 215-239, 2012. [http://dx.doi.org/10.1016/0378-8733(78)90021-7] |
| [39] | A. L. Barabási, R. Albert, and H. Jeong, "Mean-field theory for scale-free random networks", Physica A:, vol. 272, no. 1-2, pp. 173-187, 1999. |
| [40] | Y. Amihud, "Illiquidity and stock returns: cross-section and time-series effects *", J. Financ. Mark., vol. 5, no. 1, pp. 31-56, 2002. [http://dx.doi.org/10.1016/S1386-4181(01)00024-6] |
| [41] | D.K. Bebarta, and G. Venkatesh, A Low Complexity FLANN Architecture for Forecasting Stock Time Series Data Training with Meta-Heuristic Firefly Algorithm, Springer: India, 2016. [http://dx.doi.org/10.1007/978-81-322-2734-2_38] |
| [42] | R.H. Shumway, and D.S. Stoffer, Time Series Analysis and Its Applications (Springer Texts in Statistics), Springer-Verlag New York, Inc.: New York, USA, 2005. |