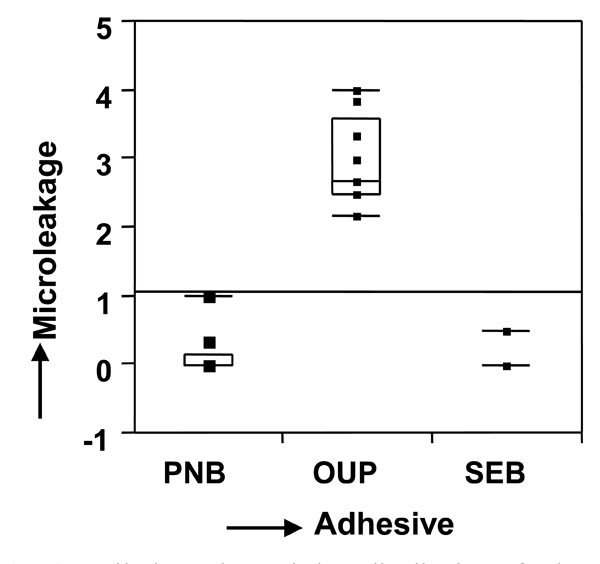
Fig. (2) Quantile box plot and data distribution of microleakage scores. The plot also shows the median scores for different adhesives (0 for SEB and PNB, 2.67 for OUP), indicating the central trends of microleakage data showing important differences.