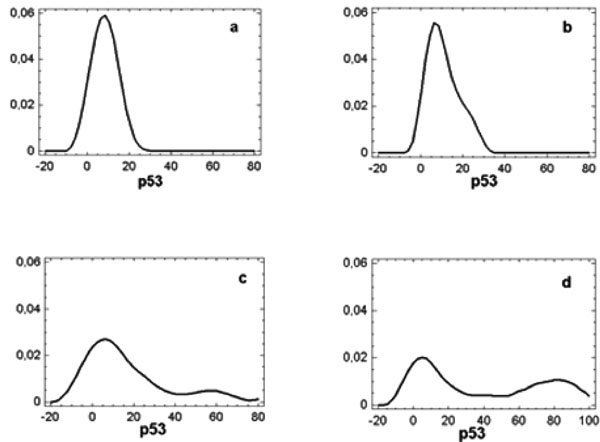
Fig. (3).
Density trace diagrams showing p53 distribution in specimens from normal mucosa
(a)
, epithelial hyperplasias
(b)
, epithelial dysplasias
(c)
and OSCC
(d)
.