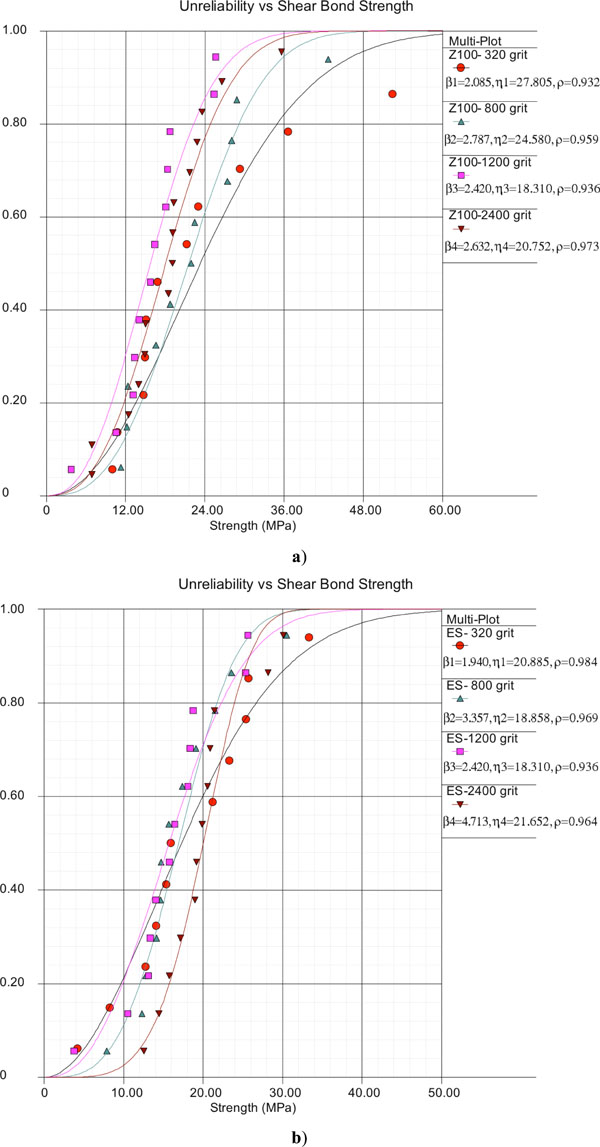
Fig. (3)
Graphs of the results of Weilbull analysis: a) composite Z100 and b) FRS eS.