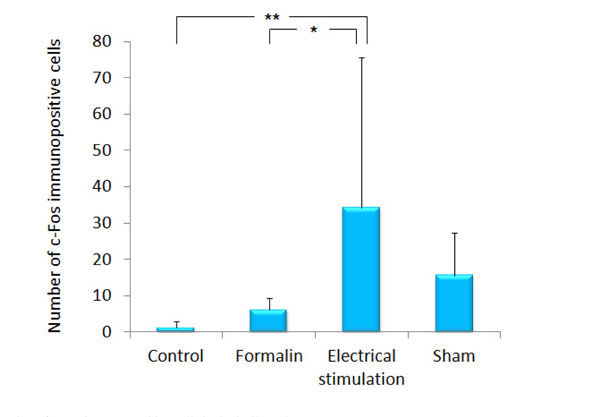
Fig. (2)
The number of c-Fos immunopositive cells in the ipsilateral ACC.The graph shows the number of c-Fos immunopositive cells in the ipsilateral ACC. Data represent mean ± S.D. of 5 rats per treatment. *p<0.05, **p<0.001.