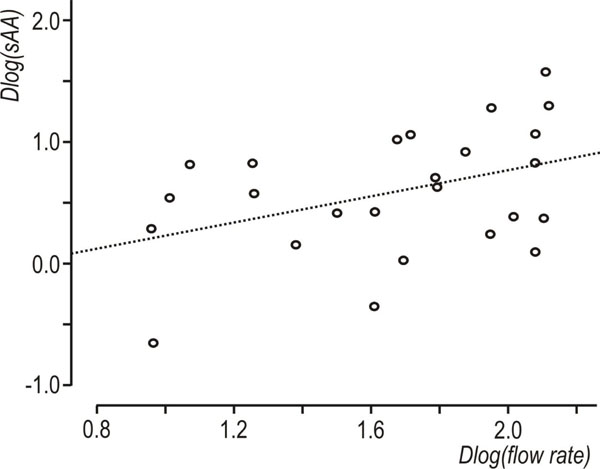
Fig. (4)
Scatterplot of Dlog(flow rate) vs Dlog(sAA), showing subjects with decreased Dlog(flow rate),
r
=0.41 N=25 (Dlog(flow rate)<2.1).