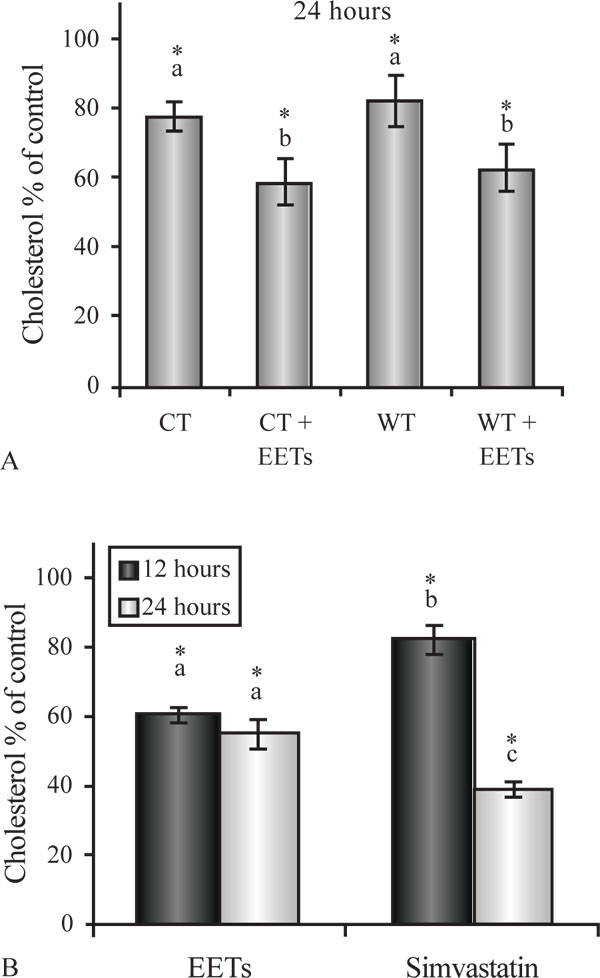
Fig. (2) A) Total cholesterol in the media from HepG2 cells expressing sEH wild-type (WT) and C-terminal hydrolase construct (CT) with and without 11,12 (5μM) and 14,15 (5μM) EET regioisomers mixture. B) EET 11,12 (5μM) and 14,15 (5μM) regioisomers mixture in absence of sEH as compared to simvastatin (5μM) at 12 and 24 hours. * indicates statistically significant difference as compared to control (P<0.05). Within each chart, different letters indicate statistically significant difference as compared to each other (P<0.05).