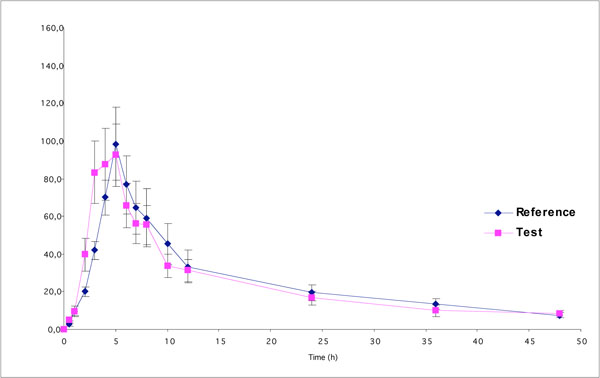
Fig. (2)
Mean plasma concentration (± standard error) versus time curves for Reference and Test products, obtained in twelve healthy women.