- Home
- About Journals
-
Information for Authors/ReviewersEditorial Policies
Publication Fee
Publication Cycle - Process Flowchart
Online Manuscript Submission and Tracking System
Publishing Ethics and Rectitude
Authorship
Author Benefits
Reviewer Guidelines
Guest Editor Guidelines
Peer Review Workflow
Quick Track Option
Copyediting Services
Bentham Open Membership
Bentham Open Advisory Board
Archiving Policies
Fabricating and Stating False Information
Post Publication Discussions and Corrections
Editorial Management
Advertise With Us
Funding Agencies
Rate List
Kudos
General FAQs
Special Fee Waivers and Discounts
- Contact
- Help
- About Us
- Search


The Open Drug Metabolism Journal
(Discontinued)
ISSN: 1874-0731 ― Volume 5, 2011
Differences in Functional Clustering of Endogenous and Exogenous Substrates Between Members of the CYP1A Subfamily
Philippe Urban*, Gilles Truan, Denis Pompon
Abstract
The ability of four mammalian cytochromes P450 (CYP) of the CYP1A subfamily, human and mouse CYP1A1s and human and rabbit CYP1A2s, to metabolize a series of steroids and related compounds was investigated using high throughput approaches. Oxidation rates and metabolite patterns for 16 steroid substrates and for 20 polycyclic aromatic hydrocarbon (PAH) substrates were determined in standardized automated conditions. Multivariate statistics of normalized activity data sets was used to sort out significant information and to compare functional signatures of assayed enzymes. Interestingly, for steroid substrates, rabbit CYP1A2 unambiguously aggregates with human and mouse CYP1A1s and appears functionally divergent from human CYP1A2. In contrast, the functional classification was found consistent with the sequence classification when exogenous PAH substrates were tested. The observed features rely on a large set of substrates, all presenting a similar chemical scaffold but decorated with different substituents similar to chemical series used in drug development. Differential functional clusters are thus evidenced for endogenous and exogenous substrates with CYP1A enzymes. A few residues on rabbit CYP1A2 that may account for its unusual 1A1-like specificity toward steroids have been identified both within the active site and at the protein surface. These specific residues thus seem to play a controlling role for global substrate class discrimination, potentially by involving substrate bulkiness and shape sensing.
Article Information
Identifiers and Pagination:
Year: 2009Volume: 3
First Page: 17
Last Page: 30
Publisher Id: TODMJ-3-17
DOI: 10.2174/1874073100903010017
Article History:
Received Date: 18/7/2008Revision Received Date: 24/10/2008
Acceptance Date: 30/10/2008
Electronic publication date: 05/2/2009
Collection year: 2009
open-access license: This is an open access article distributed under the terms of the Creative Commons Attribution Non-Commercial License (http://creativecommons.org/licenses/by-nc/3.0/), which permits unrestricted, non-commercial use, distribution and reproduction in any medium, provided the work is properly cited.
* Address correspondence to this author at the Centre de Genetique Moleculaire, CNRS UPR 2167, 91190 Gif-sur-Yvette, France; E-mail: urban@cgm.cnrsgif.fr
| Open Peer Review Details | |||
|---|---|---|---|
| Manuscript submitted on 18-7-2008 |
Original Manuscript | Differences in Functional Clustering of Endogenous and Exogenous Substrates Between Members of the CYP1A Subfamily | |
INTRODUCTION
A common idea claims that sequence similarity is of key importance in identifying conserved function. In other words, phylogeny reflects function conservation [1-3]. The cytochromes P450 (CYP) gene superfamily is one of the largest known at the genome level [4, 5]. CYP genes (and their expression products) are classified in families and subfamilies on the basis of sequence similarity [6]. It is frequently stated that this classification of sequences is relevant to function conservation for the CYPs of the same family or subfamily [7]. In animals, xenobiotic-metabolizing CYPs exhibit versatile substrate specificity that encompasses a vast array of chemicals [8, 9]. Since those CYPs are acting on xenobiotics, their substrate specificity is a major issue for drug development and chemical toxicity.
Previous observations have shown that species differences may occur in metabolic activities between CYPs belonging to the same subfamily [10-12]. Most of these effects were ascribed to translation regulation differences [13, 14]. These differences can lead to tenuous risk assessment in extrapolation of animal toxicity data to the point that an uncertainty factor was introduced to compensate interspecies differences in toxicology studies [15]. However, species-based differences in CYP-catalyzed reactions have also been ascribed to particular amino acid differences [16, 17]. Within subfamilies of CYP enzymes, an overall functional similarity is generally seen but many examples exist of changes in catalysis due to a limited number of amino acid substitutions [18 and references therein]. For instance, rat CYP1A1 hydroxylates R-warfarin while mouse CYP1A1 has no detectable activity [19]. Direct comparison of CYP subfamily enzymes on the basis of their function is the most problematic in CYP2 enzymes [20]. This type of study is flawed by the fact that a single or a limited number of substrates were compared and not classes of chemicals. This prompted us to investigate interspecies metabolism of classes of substrates presenting a similar chemical scaffold with CYP1A enzymes.
CYP1A enzymes are responsible for the metabolic deactivation of drugs [21] and some endogenous compounds [22] and, at the same time, for the metabolic activation of known procarcinogenic chemicals [23-25]. Since these enzymes are highly similar in sequence, the number of potential sequence elements that could explain any difference in functional properties should be limited.
In this work, four mammalian CYPs of the CYP1A subfamily were assayed with a set of substrates belonging to two different chemical classes, steroids and polycyclic aromatic hydrocarbons (PAHs). The first set comprises 16 steroid substrates that enabled us to monitor 56 activities for each yeast-expressed CYP. The second set comprises 20 PAH substrates enabling us to monitor 85 activities. We analyzed the global kinetic behaviour of these four CYPs with these two sets of substrates by means of multivariate statistics which enable comparisons of the observed kinetics in an easily visualized way. It is shown that CYP1A sequence subfamily classification does not match with functional clustering for metabolism of endogenous compounds (steroids) contrary to what is observed for xenobiotic PAH substrates.
MATERIALS AND METHODOLOGY
Substrates Assayed
The steroid series comprises testosterone, 17-methyltestosterone, progesterone, pregnenolone, estrone, cortisol, 19-norandrostenedione, dehydroepiandrosterone (DHEA), cortexolone, corticosterone, 17-hydroxy- and 21-hydroxyprogesterones, androsterone, epiandrosterone, and two steroid analogs: nootkatone and mifespristone (RU486). Mifepristone was a gift from Roussel-Uclaf (Romainville, France). The PAH series comprises naphthalene, acenaphthene, anthracene, 2-methyl- and 9-methylanthracenes, phenanthrene, 4,5-methylphenanthrene, fluorene, fluoranthene, 9-vinyl- and 9-phenylanthracenes, benzo[a]- and benzo[b]fluorenes, trans-stilbene, benzanthracene, 7,12-dimethylbenzanthracene, pyrene, chrysene, benzo[a]- and benzo[e]pyrenes. The different substrates were solubilized either in methanol (since ethanol is a known CYP1A inhibitor) or in dimethylformamide (DMF).
Yeast Strains and Plasmids
Vectors p1A1/V60 and p1A2/V60 for human wt CYP1A expression, pP1V8 for mouse wt 1A1 expression and pLM4V8 for rabbit wt 1A2 expression were described before [51,52]. The pYeDP60 (V60)-based vectors contain URA3 and ADE2 as selection markers, whereas the pYeDP8 (V8)-based vectors only contain URA3. The inserted coding sequence is placed under the transcriptional control of a GAL10-CYC1 hybrid artificial promoter and PGK terminator. The Saccharomyces cerevisiae W(R) strain is a derivative of the W303-1B strain (MATa; ade2-1; his3-11,15; leu2-3,112; trp1-1 [53]. For expression of CYP1A variants and wt enzymes, the W(R) yeast strain was chosen since yeast NADPH-P450 reductase overexpression optimizes the activities of recombinant CYP. Transformant growth, galactose induction in YPGE medium, and microsomal fractions preparation were carried out as previously described [54].
Enzyme Activities with Steroids
Incubations with steroids (initiated by NADPH addition), reaction quenching with trifluoroacetic acid (2:250 by vol.), and acetonitrile extractions were automatically performed with a QIAgen 8000 robot using a homemade QIAsoft program. The HT procedure for the functional screening of CYP1A enzymes consists in incubation of the different pairs (enzyme, substrate) in each well of a 96-well microplate. Microsomal fractions of recombinant yeast clones each expressing a particular CYP1A enzyme were assayed with the 16 steroid substrates in a round-bottom 96-well microplate (well volume = 0.30 ml) by incubation at 30 °C for 0, 5, 10, 15, and 20 min. A systematic control was included for each chemical tested and consisted of a 20-min incubation with microsomal fractions prepared from W(R) cells transformed by void vector. After incubation completion, microplate content was transferred by the robot to a second microplate for acetonitrile extraction (1:1 by vol.) and, after centrifugation (5 min at 3,500 rpm) this plate was transferred to a third 96-well Porvair microplate which fits in the automatic injector compartment of an Alliance HT2795 HPLC Waters module. For all steroid substrates, the initial concentration in incubation mixtures was 100 µM. Microsomal steroid hydroxylation and RU486 N-demethylation activities were shown to be strictly NADPH-dependent, as no reaction was observed with NADH. Microsomes from control yeast cells transformed by a void vector show no detectable signal for all these activities.
Analytical LC/MS Methods
The acetonitrile extracts were LC-separated at 40°C with an XTerraMS C18 5µM 4.6x100 mm column (Waters) and analyzed on a Micromass ZQ single quadrupole mass spectrometer (Waters). The solvent system consisted of H2O + 0.01 % formic acid (by volume) in acetonitrile + 0.01 % formic acid (by volume). The gradient used for all steroid metabolites starts at 90:10 (water:acetonitrile), followed by a gradient from 85:15 to 0:100 over 8 min, followed by a return to initial conditions and hold for 2 min; total run length 10 min with a flow rate of 1.0 ml/min. Parameters of the electrospray positive ionization were as follows: capillary voltage 3.4 kV, cone voltage 20.0 V, desolvation gas flow 550 L.h-1, desolvation temperature 350°C, source temperature 120°C. Continuous metabolite mass detection was using both full scan spectra by scanning mass range 200-500 amu and several SIM channels set at the precise m/z corresponding to the expected protonated metabolites (hydroxylated derivatives of all substrates plus the N-demethylated metabolite of RU486). The masses of each substrate being known, it was possible to specifically detect the mass of predicted hydroxylated (+16 amu) and N-demethylated products (-14 amu). The detected m/z corresponds to [M+H]+ since positive electrospray mode is used. Metabolites were quantified by measuring peak areas on mass spectra chromatograms. The area of each MS detected product peak was plotted versus the time of incubation (0, 5, 10, 15, and 20 min) yielding the rate of reaction which was transformed in specific activities.
Enzyme Activities with PAHs
Except for some PAHs as stated below, a 0.30-ml reaction mixture containing 0.4-0.6 mg/ml protein from yeast microsomal fractions each expressing a unique wt or variant CYP1A proteins, 0.2 mM NADPH, and a saturating concentration of substrate delivered as a methanolic or a DMF solution (final concentration MeOH 0.7% or DMF 0.3 %, respectively) in Tris-HCl 50 mM, EDTA 1 mM buffer (pH 7.4) was incubated at 28°C. Initial velocities were measured by plotting against time the peak area for each of the detected metabolites produced at 5, 10, 15, and 20 min of incubation. Recombinant human microsomal epoxide hydrolase was systematically added (100 µg transformed W(R) yeast microsomal protein per assay mixture) to incubations, except for acenaphthene, naphthalene, phenanthrene, benzo[a]-, and benzo[b]-fluorene. The reaction was quenched with 10 µL of TFA 50% in water. One volume of acetonitrile was added and the mixture was centrifuged at 10,000 rpm for 10 min to remove membranes and precipitated proteins. Initial concentrations of PAH substrates were 130 µM, except for naphthalene (0.5 mM), acenaphthene (160 µM), benzo[a]pyrene (25 µM) and benzo[e]pyrene (33 µM). These initial concentrations were found saturating, in agreement with published data on some PAH binding measured with both wt CYP1A enzymes (Ki in the 2-200 nM range and Km in the 1-10 µM range) [30 and references therein]. All activities were shown to be strictly NADPH-dependent, as no reaction was observed with NADH. Microsomes from control yeast cells transformed by a void vector show no detectable signal for these activities.
Metabolite Separation and Detection for PAH Substrates
Separations were carried out on a Spheri-5 RP18 5 µm Brownlee column (4.6x100-mm) set in an Alliance HT2795 Waters separation module equipped on-line with a Waters 2487 dual absorbance detector and a Waters 2475 fluorescence detector. The column was heated at 40°C for better peak resolution. Three different separation procedures differing by the total runtime were used depending on the PAH molecule studied. Procedure 1 consisted of a 31-min separation using a gradient from water containing 0.02 % trifluoracetic acid to 50 % acetonitrile (by volume) in 20 min, followed by a 4 min elution in 100 % acetonitrile. The column was regenerated with acidified water for 7 min. Procedure 2 consisted of a 42-min separation using a gradient from 15 % to 100 % acetonitrile in water containing 0.02 % trifluoracetic acid with increasing acetonitrile to 40 % in 16 min, then increasing to 50 % acetonitrile in 4 min, increasing to 75 % acetonitrile in 11 min, and reaching a 4 min plateau at 100 % acetonitrile. The last procedure consisted of a 12-min separation using a gradient from 10 % to 100 % acetonitrile in acidified water with increasing to 50 % in 10 min and reaching a 2 min plateau at 100 % acetonitrile. The PAH metabolites were quantified by measuring peak areas on chromatograms from fluorescence signals. For identification of metabolites from benzanthracene, benzo[a]pyrene, benzo[e]pyrene, chrysene, dimethylbenzanthracene, pyrene, the fluorescence detection was set at 278 nm for excitation and 407 nm for emission. For identification of all other PAH derivatives, the fluorescence detection was set at 288 nm for excitation and 360 nm for emission.
Data Pre-Processing (Normalization)
For steroid activities, normalization took into account surface area of the substrate peak to evaluate detector response coefficients for the corresponding metabolites. Since steroids contain ionisable groups which are different from one molecule to the other, electrospray ionisation could exhibit different response coefficients. These ionisable groups being conserved in the products, the substrate response coefficient can be used as a fair reference to normalize the rates of metabolite formation. We also tested another normalization procedure based on the variance in the dataset.
Statistical analysis raises the important question of data normalization. In data sets obtained with biological objects, the term normalization does not necessarily refer to the assumptions of normality mostly because biological parameters can be obscured by several simultaneously operating sources of variability. In contrast to sequence, encoded in a non-ambiguous manner by a chain of amino-acid letters, the function of an enzyme is a fuzzy notion, especially for enzymes presenting a broad specificity such as CYPs. Building a phylogenetic tree is made simple by a metric of standard distances that link any sequence alignment to a score of sequence similarity [55]. Enzyme function sharply contrasts with this situation since it requires a multidimensional definition more difficult to express. Quantitative descriptors, such as catalytic efficiencies (kcat/Km), are frequently preferred for functional description due to their easy correspondence to intrinsic thermodynamic parameters in the case of a perfect Michaelian enzyme [56]. But determining catalytic efficiencies on a large set of activities for several orthologous enzymes is a time-consuming task. In this paper, we made the choice of an approach based on two normalization procedures. The first method was adapted to the CYP-catalyzed activities determined with steroid substrates, while the second was adapted to the particularity of PAH assays. The two resulting metrics reflect both substrate affinity and specific activity and thus must be considered as a signature of relative, not absolute, substrate specificity. This signature gives a similar weight to any substrate since we used saturating substrate initial concentration in all cases.
Most frequently, normalizations are based on mean-centering and reduction (i.e. dividing data by standard deviation). This is so done to transform the distribution of the initial data into a Gaussian function as much as possible. From a biological viewpoint, experimentalists are interested in and will pursue only the exceptional cases. Mean correction methods, such as mean-centering, may unintentionally introduce false outliers since these methods are know to best correct for the average or median cases and not the outliers. In the case of a data set of kinetic values, such as in this work, mean-centering results in transformed data which are now centered on zero so as half of them are negative. A negative value in the case of genome-wide studies or in microarray data is correct since the data normalized are ratios of the logarithm of physical measurements. In the case of specific activity, a negative value is simply meaningless. The reduction of data by dividing initial values with standard deviation is a normalization based on the mathematical expression of the Gaussian function, also called normalization to unit-variance (the square root of 1 equals 1). The choice of the standard deviation is an ad hoc procedure to divide the initial value by a number of the same dimension. A more correct way of correction would be to choose the variance, which is equal to the squared standard deviation. As demonstrated by Fisher [57], it is desirable, when analysing a phenomenon characterized by several independent causes of variability, to deal with the variance as the measure of variability since the resulting global variance is the sum of each individual variance. Such a relation does not exist for corresponding standard deviations. In our work, we thus decided to reduce data by dividing them by their variance; hence the choice of non-centering data and of reducing them by variance instead of standard deviation.
In the case of steroid substrates, two preprocessing methods were carried out and compared on the initial data set. The first takes into account the response of the substrate to the mass spectrometer. This is done by applying the following correction:
Xnorm = Xobs . (Ā / Ai)
where Xnorm is the normalized activity for a metabolite derived from the ith substrate, Xobs the initial activity data, Ā the average area of the mass signals of all 16 substrate peaks (as measured on TIC profiles) and Ai the area of the mass signal of the ith substrate. The second normalization procedure is reducing the initial data set by its column variance.
In the case of PAH substrates, preprocessing was carried out by dividing the values of the initial dataset by the row-column double variance:
Xnorm= ( Xobs/ Varcol) / Varrow
This was done because a fluorescence detection system was used. Fluorescence responses of the different PAH metabolites can be greatly different from one metabolite to the other. For example, naphthol-1 is ≈ 70-fold less fluorescent than naphthol-2, the two naphthalene metabolites produced by CYP1A enzymes. Since the 1-hydroxylation reaction of naphthalene is catalyzed by CYP1A1 enzymes to a ≈ 75-fold higher rate than 2-hydroxylation reaction, the observed fluorescence peaks for both naphthols appear of a similar size on HPLC traces in our detection system. The analysis of the source of ‘noise’ in the dataset has shown that preprocessing should concern both the columns (variations of fluorescence response from one metabolite to the other) and the rows (variations in expression levels and stability of the recombinant enzyme).
We used a non-zero lower limit for specific activities when activity was not detected experimentally. This lower limit is calculated as specific activity determined at the detection limit of the mass spectrometer (in the case of steroid specific activities) or of the fluorescence detector in the case of PAH activities. This was done to prevent zero values from dominating the final statistical outcomes.
Multivariate Statistical Analysis of Data
Changes in substrate specificity observed between CYP1A enzymes were analyzed globally by principal component analysis (PCA) and by multidimensional scaling (MDS), two statistical tools of complementary interest as has been shown in several fields of ecology [58,59], genome-wide research based on DNA microarrays [60,61], mechanisms of liver tissue regeneration [62], and, more recently, exploration of the protein structure space [63,64]. The representation of error in the PCA plot was based on drawing an ellipse in which the duplicate points are the two foci and major and minor axes are such that the ellipse fits the x-axis and y-axis error bars. An ellipse keeps information about direction, which is at the core of principal component analyses.
PCA is a classical dimensionality reduction method corresponding to a linear projection of objects originally in an n-dimension space into a projected space of much lower dimension (from n-1 down to 2).This data analysis method thus intends to extract and visualize systematic patterns or trends of variation in large data sets. In this work, PCA is used to project objects (the CYP1A enzymes) from their original 56-dimensional (for steroids) or 85-dimensional (for PAHs) spaces into a 2-dimensional space for ease of visualization. The different trends of variation hidden in the initial multidimensional space are evidenced since the new orthogonal axes of the projected space (the two first principal components) are derived from the directions of most variability.
MDS is a classical tool in data analysis. It aims at building a map of objects only described by a distance matrix (similarities or dissimilarities). MDS is a nonlinear projection of the distances separating each object from the others into a Euclidean 2- or 3-dimensional diagram designated as the MDS configuration plot. The trends of variation are not observed in MDS but, instead, they show how close, or how far, are different objects in the original data set. MDS configuration plots enable one to measure distances between two objects considering at the same time the influence of all other objects. However, bivariate statistical analysis compares objects two-by-two without taking into consideration all objects globally. In MDS, the configuration space is built by keeping as faithful as possible the distances separating each objects, but, since this method is nonlinear, the global topology is not maintained. For instance, a cloud of randomly separated objects will result in a series of points forming a circle in the resulting MDS plot. In a circle, the distribution of distances from one point to all the other points is identical whatever the point considered, as are distances in a cloud of randomly separated points. There is, like in any nonlinear method, a possible dependence of the results on the initial configuration and on the MDS model used since it is known that nonlinear optimization processes are not free of the local minima problem. MDS and PCA projections are not sensitive to the number of objects compared as soon as these objects are described in a high-dimensionality initial matrix. The most rigorous method to evaluate the reliability of a MDS analysis is calculation of a diagnostic index known as Kruskal’s stress (see Experimental Procedure) for STandardized REsidual Sum of Squares). This index is a loss function that measures the closeness of the mapping from distances in the original space (the proximities) to distances in the MDS configuration plot. Briefly, this function is proportional to the squared difference between the dij distance separating two points on the MDS configuration 2D plot and the δ ij distance separating the same two points in the original n-dimensional space.
The multivariate statistics and dendogram construction were performed by using Addinsoft XLSTAT2007 software. Datasets and correlation matrices used throughout this work are available upon e-mail request from urban@cgm.cnrs-gif.fr.
Human CYP1A2 3D Structure
The atomic coordinates at 1.95 Å were taken from the Protein Data Bank, RCSB, Rutgers University (entry: 2HI4). Visualizations were performed by using PyMol (Delano Scientific LLC, San Carlos, CA, USA).
RESULTS
Bivariate Analysis of the Differences in CYP1A Steroid Metabolism
The four wild-type (wt) CYP1A enzymes (human CYP1A1 and CYP1A2, mouse CYP1A1, and rabbit CYP1A2) were expressed in yeast and microsomal fractions were prepared and assayed with a collection of 16 steroids (Fig. S1); see the Supplementary material). The two steroid analogues used in this work were mifespristone or RU486, the active principle of the abortive pill, and nootkatone, one of the main components of grapefruit essential oil. The yeast expression system used was such that the only microsomal CYP produced in significant amount is the recombinant mammalian form.
With this set of substrates, 56 metabolites were detected by mass spectrometry, each one constituting a particular activity catalyzed by at least one of the four CYP1A enzymes. All activities are hydroxylation reactions with the exception of the mifepristone N-demethylation reaction. The rates of metabolite production were determined at a saturating substrate concentration for each CYP1A enzymes and the specific activity calculated (Table S1).
A simple visual inspection of the data was first attempted by representing the contribution of each steroid substrate to the total mono-oxygenase activity catalyzed by each of the four CYP1As. To do this, the total hydroxylase activity of a given steroid substrate was calculated by summing the specific activity determined for each one of its metabolites. Then each one of the 16 different total activities calculated that way was expressed as a percentage relative to their sum. These percentages were then represented for each CYP1A enzyme on a segmented histogram in which the length of each segment is proportional to the contribution of each corresponding steroid substrate (Fig. 1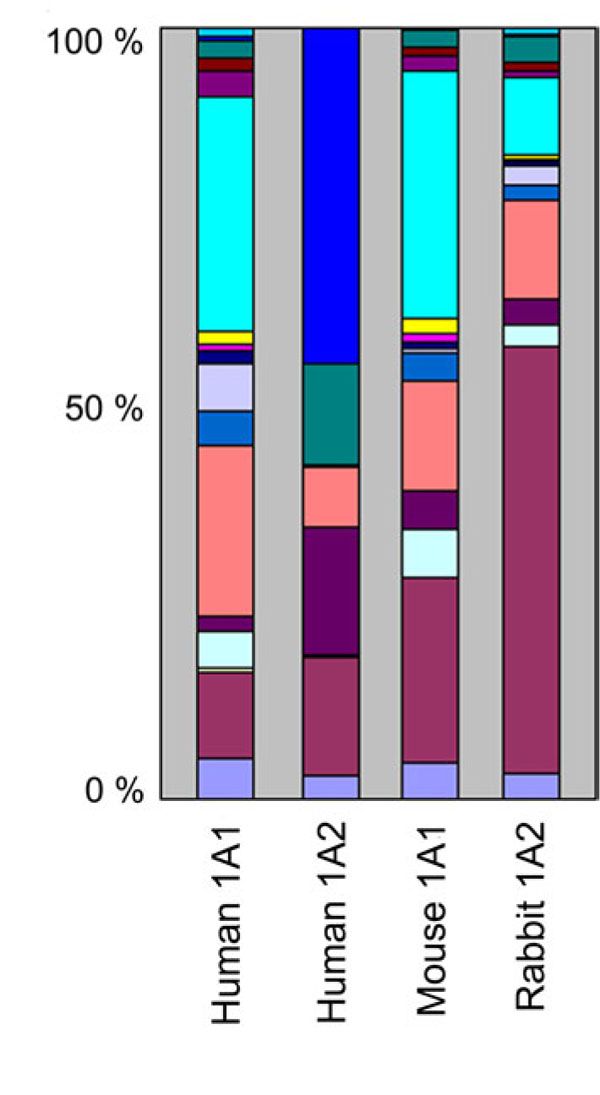 ).
).

This figure reveals that: 1) human and mouse CYP1A1s have fairly similar steroid substrate activity profiles, 2) human CYP1A2 and human CYP1A1 have markedly different profiles, 3) human CYP1A2 does not metabolize several steroid substrates that both CYP1A1s metabolize, and 4) the rabbit CYP1A2 steroid specificity profile closely resembles those of both CYP1A1s. In fact, human CYP1A2 does not metabolize ten of the sixteen steroid substrates used in this study to levels detectable in our assay conditions. On the contrary, each of the sixteen steroids is a substrate for both CYP1A1s and rabbit CYP1A2. It is clear from this bar graph that human CYP1A2 has a predominant 19-norandrostenedione hydroxylase activity which is limited for the other CYP1A enzymes. Similarly, human CYP1A2 presents a noticeable hydroxylase activity toward cis-androsterone, contrary to the three other CYP1As. Moreover, human CYP1A2 presents no detectable hydroxylase activity toward 17-methyltestosterone, contrary to what is observed with other CYP1A enzymes. However, all four mammalian CYPs exhibit similar testosterone and progesterone hydroxylase activities. The steroid substrate specificity clearly distinguishes rabbit CYP1A2 from human CYP1A2.
Fig. (2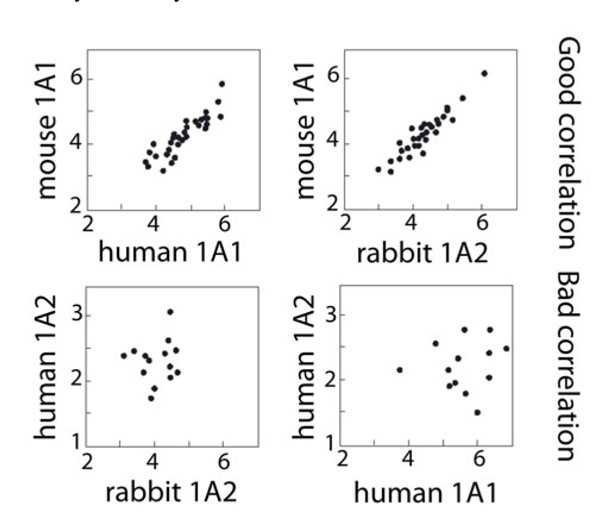 ) presents a log-log plot comparison of the four mammalian CYP1A enzymes two-by-two with respect to the 56 steroid activities. In such a plot, each point represents a particular steroid activity whose coordinates are its values measured for each of the two enzymes compared. The two upper panels present well correlated pairs of enzymes. The two lower panels show enzymes presenting badly correlated pairs. Quite unexpectedly, rabbit CYP1A2 was found to be as well correlated to mouse CYP1A1 as human and mouse CYP1A1s are. Steroid activities of human and rabbit CYP1A2s were found to be poorly or even not correlated. However, this representation is flawed by the fact that comparisons two-by-two are not taking into account globally the four enzymes assayed.

A first way to simultaneously compare CYP1A enzymes is metabolite pattern analysis. To do this, the enzymes were compared on segmented histograms comparing the same subset of steroid activities among the 56 measured for each CYP1A enzyme (not shown). A maximal value of 7 different activities can be compared at once on a segmented bar, but beyond this limit the information is obscured and not easily visualized. Depending on the activities chosen, two clear situations emerge from the different comparisons. Either the activity profile of rabbit CYP1A2 looks similar to that of both CYP1A1s (as observed with total activities), or the comparison shows unexpected correlations that contradict the previous observation. For instance, human CYP1A1 and human CYP1A2 present similar metabolite patterns for cortexolone, pregnenolone and DHEA, whereas rabbit CYP1A2 exhibits a metabolite pattern for these three steroids which is clearly different from those of the three other CYP1A enzymes. Since different comparisons can end up with different conclusions, it is necessary to compare all 56 activities together. An exhaustive survey of all comparisons possible seven-by-seven for the 56 steroid activities measured would need to trace hundreds of such histograms. This is clearly out of the scope of this paper and even out of human ability to fully comprehend them. We thus skipped data analysis related to global comparisons by using the mathematical tools proposed by multivariate statistics.
Multivariate Analysis of CYP1A Steroid Metabolism
The main interest of multivariate statistical methods is that they describe most of the information with considerably fewer variables than originally present. In our case, the original data set of steroid activities corresponds to a space in which each CYP1A enzyme is represented by a point and each activity is one of the dimensions. The multivariate statistical methods summarize the whole figure by projecting the objects (the enzymes) in a new space of considerable lower dimensionality (bidimensional or three-dimensional) while keeping most of the information present in the original data.
Normalization (i.e. pre-processing of the data) was carried out to remove most of the influence of non-controlled parameters such as different expression levels from one enzyme to another, differences in ionization processes from one steroid to another, etc. All these parameters obscure the information contained in the raw data and can be designated as ‘noise’ [26]. For steroid data sets, normalization consisted of correcting substrate and metabolite signals on mass spectrometer by the ratio taking into account the average area of the mass signals for the 16 steroid substrates assayed (see Experimental Procedures).
Systematic exploration of the normalized data set was done by using hierarchical clustering and two methods of dimensionality reduction, principal component analysis (PCA) which is a linear transformation procedure [27-29], and multidimensional scaling (MDS) which is a nonlinear transformation procedure [30-32]. These transformations use as much as information as possible from the entire data set in plotting dissimilarities (hierarchical clustering and MDS) or variability (PCA), and not just the one correlation between any two enzymes (as is the case in Fig. (2) plots).
The first visualization method applied to the steroid data set was agglomerative hierarchical clustering whose purpose is to sort out objects into groups in a statistically objective way (Fig. 3A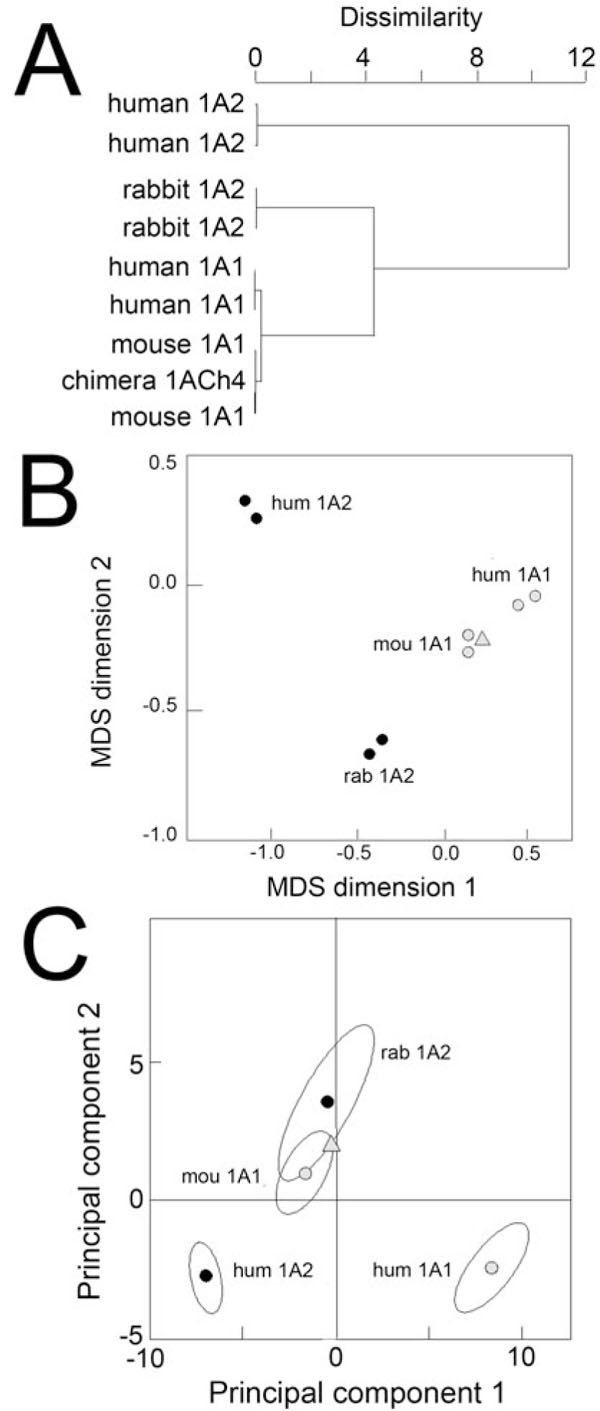 ). This traditional method yields a binary clustering tree (a dendogram) which visualizes in our case the relatedness of enzymes with regard to steroid metabolism. Similar enzymes are found located in the same branch. Distant enzymes are found in well separated branches. Both human and mouse CYP1A1s are aggregated together in the same branch of the tree, and human CYP1A2 is found in a well-separated branch of the tree. However, rabbit CYP1A2 aggregates in a branch which is different from that containing human CYP1A2. This difference is statistically significant since these two branches correspond to partitions the furthest apart. As expected, each assay is positioned close to its duplicate, confirming good homogeneity of the data set.

The second method tested was MDS whose goal is to represent as best as possible in the two-dimensional MDS configuration plot the distance between any two objects (the enzymes) in the original multidimensional space. A correlation matrix deduced from the data set of normalized steroid activities was used since it is the best representation of the distance between objects in a multi-dimensional space. Two enzymes plot close together in an MDS plot if and only if their global behaviour towards steroid activities is similar. The closer, the more similar they are. The strength of MDS analysis stems from the use of as much information as possible from the entire data set when plotting similarities, not just the one correlation between any two objects.
In the Fig. (3B) configuration plot, the two CYP1A1 enzymes are found close to each other. Rabbit CYP1A2 duplicate assays cluster in an area of the graph which is quite distinct from human CYP1A2. Moreover, rabbit CYP1A2 is unexpectedly found closer to mouse CYP1A1 than to human CYP1A1, a situation that cannot be seen by hierarchical clustering (not seen in Fig. 3A). This suggests that the global kinetic behaviour of rabbit CYP1A2 towards steroid substrates is indeed of the 1A1-type, however, with respect to steroid specificity rabbit CYP1A2 is as far from human CYP1A2 as it is from human CYP1A1. This and the previous results thus show that rabbit CYP1A2 presents a global particularity in its steroid specificity which constitutes an anomaly relative to its CYP1A2 phylogeny.
PCA is another dimensionality reduction method that is a 100 year old mathematical technique credited to Karl Pearson [33] and its properties as well as the interpretation of principal components have been investigated extensively. PCA transforms linearly the points such that the first principal component (the new x-axis of the projected plot) retains most of the variance in the initial normalized data. The second principal component (the new y-axis) describes the most variation remaining in an orthogonal direction and so on with the principal components of further ranks. Therefore, a PCA projection highlights the different trends of variation that exist in the original high-dimensional space.
In Fig. (3C), a first trend can be found by comparing enzymes of the same species. From human CYP1A2 to human CYP1A1, the observed trend of variation is roughly parallel to the first principal component which retains slightly more than 60 % of the initial variance. The first principal component explains almost two thirds of the data set variability and sorts enzymes mostly according to their ability to metabolize steroids. When comparing two enzymes from different species, human CYP1A2 and rabbit CYP1A2, a second trend of variation is observed that is mainly defined by the second principal component. These results were found independent of the normalization method used, by substrate peak area coefficient or data variance (Fig.
S2). The particularity of rabbit CYP1A2 toward steroid substrates is thus real and not spurious. Moreover, the internal consistency of input data was demonstrated by the fact that 1ACh4, which is mostly of mouse CYP1A1 sequence, is systematically found close to mouse CYP1A1 assays in the three analyses reported.
Influence of the Multidimensional Scaling Model Used
MDS analysis is still not straightforward in enzymology, and some caution should be taken before dealing further with conclusions. The main pitfall that can be considered is that MDS, being a nonlinear method, may generate several solutions due to the existence of several relaxation minima during the process of dimensionality reduction. The most rigorous method to evaluate the reliability of a MDS analysis is calculation of a diagnostic index known as Kruskal’s stress (see Experimental Procedures). The MDS plot corresponding to the configuration which exhibits the smaller calculated stress is the most faithful one. In our case, a stress value of 0.063 was calculated for objects in Fig. (3B), a satisfactory value since a stress lower than 0.150 is generally considered good.
To test whether the MDS pattern found was not an artefact that would be due to the particular MDS model used for that projection (here the absolute model), we compared the results obtained with three other models (interval, ratio and polynomial) (Fig. S3). The dependence on the MDS model is very weak, with a notable rotation of the points related to the two orthogonal axes which does not modify interpoint distances. The different MDS configuration plots are thus essentially identical whatever the model used. We thus may regard the embedded structure revealed by MDS as a faithful representation of the information in the original multidimensional data set. The particularity seen with rabbit CYP1A2 toward steroid substrates is not due to the MDS model chosen for dimensionality reduction, but, rather, to some intrinsic CYP functional property.
Links Between Structure of Steroid Substrates and CYP1A Function
Previous analyses include information from individual metabolites. To assay the global substrate recognition, total activities were determined as described above. The response coefficients in mass spectrometry of the different metabolites of the same substrate were assumed similar since ionisable chemical groups are conserved between a substrate and its derived metabolites. For sake of clarity, RU486 N-demethylase activity was kept separate from the sum of RU486 hydroxylase activities. The resulting data set was normalized to the average area of mass signal and transposed so as substrates became objects on which the statistics operate.
The deduced correlation matrix was then used to extract a MDS configuration plot in which the objects are steroid substrates. This plot shows how similar (close) or dissimilar (distant) are the behaviours of the 16 steroid substrates for the four CYP1A enzymes studied here (Fig. 4A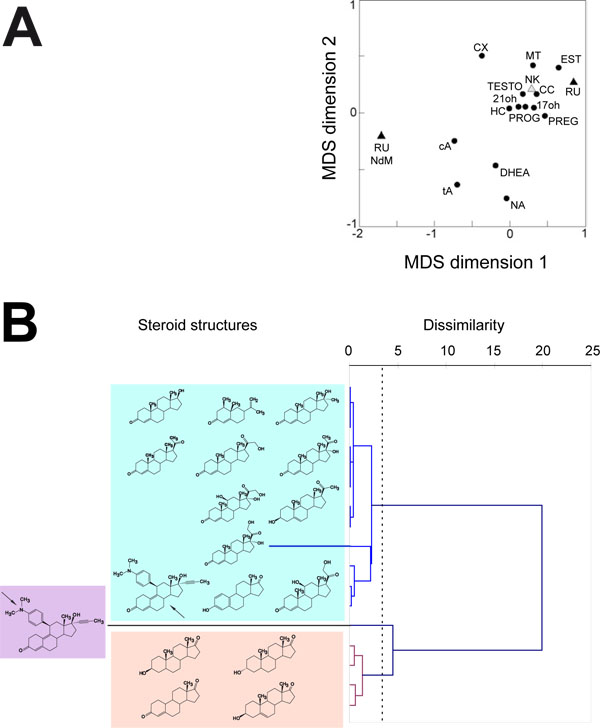 ). The resulting scatter plot shows that steroid substrates fall within three distinct groups. One contains a singleton, the RU486 N-demethylase activity. This result is not surprising since this activity is unique to this chemical in the series of steroid substrates tested. A second apparent group contains four steroids, the two androsterones (cis and trans), DHEA and 19-norandrostenedione which are all simple steroids with very few side groups on their molecular scaffold. The third group contains most of the steroid substrates, including the total RU486 hydroxylase activity. Estrone, which is also a simple steroid molecule, falls in this group but the A ring is aromatic in estrone contrary to what is the case for the steroids belonging to the previous cluster. Due to its A ring aromaticity, estrone is more testosterone-like and this could explain its classification in this third group. The RU486 hydroxylase activity (RU point) is found quite distant from the N-demethylase activity (RU NdM point) despite both acting on the same molecule. This shows that mifepristone N-demethylation and hydroxylation reactions are catalyzed by two completely different mechanisms by the CYP1A enzymes tested. This probably reflects two opposite geometries of binding for the substrate within the active site and, thus in its movement from the protein surface to the catalytic cavity.

A dendogram built by the Ward method applied to dissimilarity between steroid substrates was calculated from the correlation matrix used for MDS analysis (Fig. 4B). The chemical structure of corresponding steroid substrate is indicated in front of each branch of the resulting dendogram. This second way of looking at the behaviour of steroid substrates toward CYP1A enzymes also shows that three significant clusters exist that describe a phylofunctional classification totally similar to the one derived from the MDS plot, thus confirming it.
Substrate Discrimination Toward PAHs is Consistent with CYP1A Phylogeny
Would the particularity seen with rabbit CYP1A2 and steroid substrates be observed with another class of chemicals? The four CYP1A enzymes were assayed with a set of PAH substrates of increasing molecular size, from two benzene rings (naphthalene) up to five (benzopyrenes) (Fig. S5). PAHs are a group of more than 100 chemicals that are metabolized to a variety of compounds, some of them highly carcinogenic [34], which are hydroxylated efficiently by CYP1A1 enzymes mostly [35].
With this set of 20 PAH substrates, 85 different fluorescent metabolites were detected and corresponding activity was measured for each CYP1A enzyme (Table S2). Non fluorescent metabolites were not taken into account. For most incubations with a PAH molecule, recombinant human microsomal epoxide hydrolase (mEH) was added in order to transform the epoxides produced, which are generally poorly fluorescent, into easily observed dihydrodiol products. The amount of mEH-expressing microsomal fractions added was chosen so as to not be limiting. In case this condition could not be fulfilled, the corresponding metabolites were excluded from assays. The PAH data set was normalized by the two variance method (row and column variances).
The correlation matrix deduced from the normalized data set was used to build the corresponding MDS configuration plot. Two distinct clusters occur after MDS transformation (Fig. 5A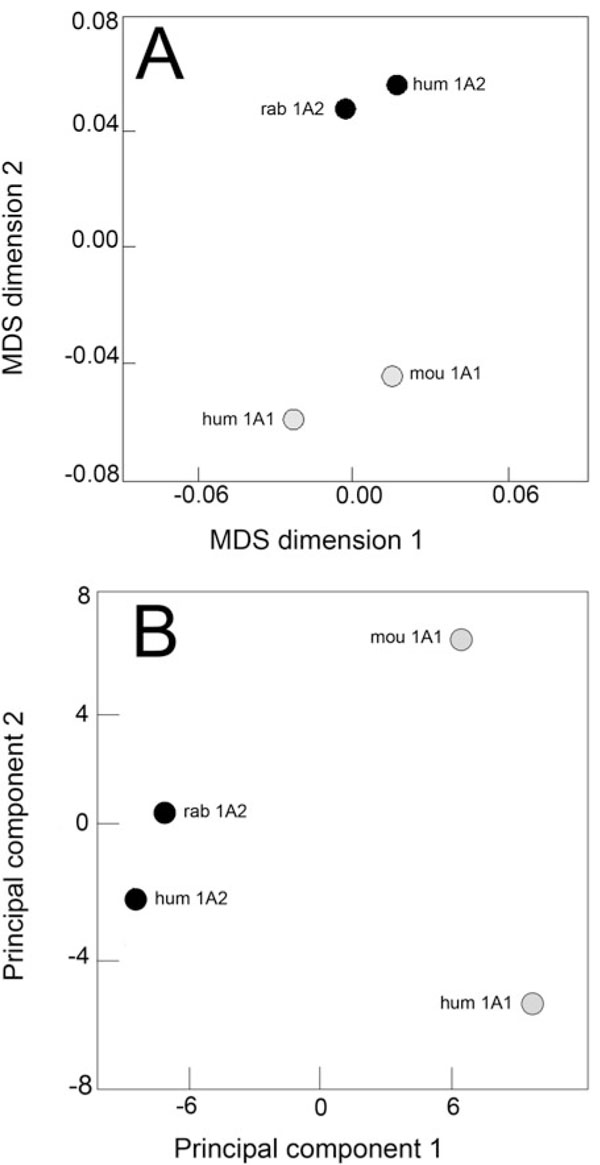 ), one comprises the two CYP1A1 enzymes (human and mouse) and the second comprises the two CYP1A2 enzymes (human and rabbit). A significant distance separates both pairs, the inter-cluster distance being 4-times the within-cluster distance. With respect to PAH specificity, the behaviour of rabbit CYP1A2 is thus identical to that of human CYP1A2. For its behaviour toward PAH substrates, rabbit CYP1A2 is much closer to another CYP1A2 enzyme from a different species than to any CYP1A1 enzymes.

When transformed by PCA, the same situation is observed with a distinct difference concerning the two CYP1A1 enzymes (Fig. 5B). The first principal component, which retains 73 % of the initial variance in data, runs from enzymes exhibiting low mono-oxygenation rates to enzymes having high rates of transformation as was observed in the case of steroid substrates. This result shows what has been known for a long time: PAH molecules are 1A1-preferential substrates. The second principal component, which explains 22 % of the initial variance in the data set, is mainly distinguishing thetwo CYP1A1 enzymes since both CYP1A2s have a PC2 value close to zero. This second component distinguishes human CYP1A1 from mouse CYP1A1. The trend of variation thus evidenced cannot be easily ascribed, but it shows that mouse CYP1A1 is not a good model of human CYP1A1 for PAH metabolism. However, these results contrast sharply with what was observed with steroid substrates. Regarding PAH specificity among CYP1A enzymes, phylogeny reflects the functional properties.
DISCUSSION
Rabbit CYP1A2 Particularity Toward Steroid Substrates
Many aspects of CYP enzymatic functions have been studied with respect to differences between pairs of ortholog enzymes; however, there has not yet been a side-by-side comparison of CYP enzymes of the same gene family from several mammalian species. In this study, we compared human and mouse CYP1A1s with human and rabbit CYP1A2s, looking at potential global differences in their enzymatic properties toward two sets of substrates, steroids and PAHs. The rates of formation of 56 steroid metabolites and of the 82 PAH metabolites were determined with each of the four CYP1As. The two corresponding structure-activity matrices were inspected by using multivariate analyses. Visual inspections and comparison of data two-by-two would have resulted in a too limited view of the kinetic data set and an overflow of data plots. Only multivariate analyses permit summarizing each matrix in a few easily understandable two-dimensional plots. The analysis presented here represents the most complete dataset to date looking at steroid and PAH specificity for CYP enzymes of the same subfamily. Rabbit CYP1A2 specificity toward PAH molecules is found to be consistent with phylogeny. However, its steroid specificity is more of the 1A1-type than of the 1A2-type, a result contradicting phylogeny deductions.
Principal component analysis on steroid data set implies that the major direction of variability is defined by the first principal component. This first component is defined by the two most apart points on the PCA diagram, human CYP1A1 and CYP1A2. A negative value for the first principal component seems to be associated both with a low number of steroids as substrates and with low monooxygenation rates; positive values would be associated with a high number of steroids being substrates and increased rates of metabolite formation. The second direction of variation shows that rabbit CYP1A2 has an effect on variation similar to mouse CYP1A1. Rabbit CYP1A2 is even found more divergent from human 1A2 in the second trend of variation than mouse CYP1A1 is. This second component in steroid activities could be ascribed to an inter-species effect most probably reflecting some evolutionary reality. Rabbits and mice belong to two closely related orders in the class of mammals. Their evolutionary separation is much more recent than the one that separated them from primates. This evolutionary fact seems to be related to the second principal component characterizing steroid specificities in CYP1A enzymes.
The particularity of rabbit CYP1A2 toward steroid substrates is best seen with MDS configuration diagram which plots apart objects that are the most different for the properties observed and plots together objects that are the most similar. Clearly, rabbit CYP1A2 is seen clustered with both CYP1A1s for steroid metabolism whereas it clusters with human CYP1A2 for PAH metabolism. The MDS configuration plot being based on the correlation matrix deduced from the normalized data set of activities, the distance separating two enzymes can be measured and used to calculate a percentage of similarity. The higher the distance on the MDS configuration plot, the lower the percentage of similarity. These values have been measured and the corresponding percentages of similarity are shown in Table 1.
Rabbit CYP1A2 was found to be highly similar to human CYP1A2 for PAH metabolism (95 % similar) and, at the same time, highly dissimilar when considering steroid metabolism (only 8 % similar, that is 92 % dissimilar). For both sets of chemicals, rabbit CYP1A2 presents a completely opposite situation with respect to its similarity with another CYP1A2 enzyme. It is important to note that the similarity measured in MDS plot takes into account not only the two enzymes compared but at the same time the whole data set and, thus, all enzymes compared together. This multivariate analysis also highlights the structural features both in substrates and in enzyme molecules that sustain the observed results.
Steroid Structural Features that Could Account for Observations
A first discrimination was observed by MDS analysis of total activities between steroid substrates depending on local chemical motifs on the substrate molecule. All steroid substrates found clustered together necessarily share highly similar properties toward the CYP1A enzymes of the collection tested. The 16 steroid molecules assayed in this study fall in three clusters. All steroids of a first cluster present a low number of substituents on their common chemical scaffold; however, the steroid molecules in the second cluster all present one or two bulky substituent at C17 position. If the C17 position bears a bulky group or if it bears a small keto group, the outcome is thus different. Therefore, a first feature of the steroid substrate recognition by CYP1A enzymes is evidenced; the nature of side groups at C17 position affects the catalytic properties. The bulkiness of the substituents at the C17 position is of crucial importance for specificity toward CYP1A enzymes.
The comparison of CYP1A recognition properties with the steroid structures was made step by step by going from the simplest steroid molecule to the most complex one in the assayed series and highlighting the steroid structures with a different colour depending on which functional cluster they belong to (Fig.
S4). This is another way of showing that the two main clusters seen in Fig. (4B) indeed encompasses two very distinct steroid molecules mostly differing at their C17 position.
The fact that both cis- and trans-androsterones fall in the same classification group demonstrates that steric hindrance at position 3 of the steroid molecule is not determinant for steroid recognition by CYP1A enzymes. A modulating effect seems to be played by A ring aromaticity of the steroid molecule. Estrone, which presents a C17 position with a keto group, is however found clustered with testosterone. Therefore, both the hindrance at the C17 position and the presence or absence of unsaturated C-C bond within the A ring of steroid substrate are both determinants for the resulting kinetic behaviour toward the CYP1A enzymes assayed in our study. This is a second feature of the steroid substrate recognition by CYP1A enzymes.
Finally, the uniqueness of RU486 is again clearly seen by its position on the MDS configuration plot, depending on whether one is looking at N-demethylase or at hydroxylase activities. The point corresponding to RU486 N-demethylase activity (RU NdM point) is found to be quite distinct from the one characterizing RU486 hydroxylase activities (RU point). Indeed, these two points are the most distant of all in the distribution. This suggests that a different mode of binding of the same molecule, RU486, would induce different outcomes; N-demethylation concerns the bulky substituent on the C10 position of the steroid molecule and hydroxylation reaction(s) could involve carbon positions on the opposite side of the molecule. Indeed, the N-demethylase activity is found to be a singleton on the MDS plot, whereas the mifepristone total hydroxylase activity is aggregated to the testosterone-containing cluster.
Therefore two important steroid structural features are characterized in this study, the substituent at the C17 position and the possibility for steroid molecules to bind in two opposite orientations within the catalytic site of some CYP1A enzymes. Apparently, the evolution within the CYP1A subfamily exerts some selection pressure on active sites to accommodate bulky steroids in two opposite orientations and on particular amino acid residues that are close to the C17 position.
CYP1A Structural Features that Could Account for Observations
To search for sequence motifs that could explain the rabbit CYP1A2 particularity with steroid substrates, we compared the sequences of the four mammalian CYP1As, and the positions systematically differentiating 1A1s and rabbit 1A2 from human 1A2 in sequence alignments have been identified (Fig. S6). Since rabbit CYP1A2 exhibits a 1A1-type steroid specificity, it should be grouped with both CYP1A1s whereas human CYP1A2 exhibits a distinct steroid specificity. Sixteen amino acid residues were thus identified, nine being located at the surface and seven being buried. Our working hypothesis is that residues critical for conferring the observed differential steroid specificity should be preferentially found among these positions. A crystal structure of human CYP1A2 has been recently published with alpha-naphthoflavone bound into the catalytic cavity [36]. We used coordinates of that structure to visualize the 16 residues identified by sequence comparisons.
Of the nine surface residues, seven are found on the same side of the CYP molecule, decorating the proximal side (Fig. 6A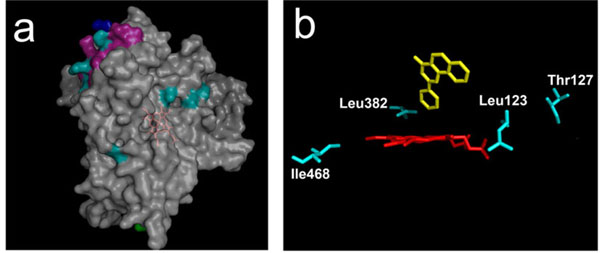 ). Moreover, three of them are all located close to each other in the same secondary element, the helix J (shown in magenta). These are Lys336, Glu338 and Lys345 in human CYP1A2 which align with, respectively, Asn, Arg and Glu in both CYP1A1s and rabbit CYP1A2. These changes result in two charge inversions and in an additional charge in human CYP1A2. That three positions be simultaneously modified in this particular helix strongly suggests that this secondary structural element could be implicated in some control of steroid specificity in CYP1A enzymes. The J helix has been involved in interaction with NADPH-P450 reductase [37] as also evidenced in a recent study with CYP17 enzyme [38]. Some altered association of the CYP with P450 reductase may thus contribute indirectly to the particularity of rabbit 1A2 steroid specificity observed in this study. Rabbit CYP1A2 harbours a J-helix which is clearly of the 1A1-type in sequence, as is its behaviour toward steroid substrates. This suggests that some differential control of the redox cycle, not covarying with phylogeny, could take place in CYP1A enzymes. This hypothesis is sustained by previous studies which demonstrated an unusual stability of rabbit 1A2 toward exposure to cumene hydroperoxide, contrary to what was observed for 1A2 enzymes of other species (Pompon D, Coon MJ, unpublished results). For PAH substrates, interaction with reductase would not be discriminating.

Four of the seven positions buried within the protein molecule are located close to or at the catalytic site (Fig. 6B). Leu123 and Thr127 are located within substrate recognition site 1 (SRS 1) [39], and Leu382 is one of the 22 residues lining the active site cavity as seen in human CYP1A2 structure. Leu123 and Thr127 are close to residues that were found implicated in controlling activity levels but not the substrate specificity in previous mutagenesis experiments [40, 41]. Leu123 is found contiguous with two residues, Ser122 and Thr124 that line the CYP1A2 catalytic cavity, so some steric effects could also occur. However, this region appears to not be involved in a significant substrate specificity control.
Szklarz and colleagues found that a L382V mutation introduced in human CYP1A2 has a clear effect on 7-ethoxy- versus 7-methoxyresorufin discrimination [42, 43]. Our results also pinpoint this particular residue as being important, this time for steroid substrates. From our results, its implication in PAH substrates discrimination would not be determinant. The contribution of residues identified by sequence comparison in specificity toward steroid substrates in rabbit CYP1A2 could benefit from further site-directed mutagenesis experiments, except in the highly likely case in which combinations of residues control substrate specificity.
CONCLUSION
The distinction observed for steroid substrates with respect to the CYP1A enzymes defines several groups of substrates sharing a similar behaviour. This result highly suggests that different types of orientations of the steroid molecule at CYP1A active site could exist. Rabbit CYP1A2 particularity with steroid substrates further reveals several amino acid residues that affect active site flexibility. These residues can be close to or far from the catalytic cavity as shown when positioning them on CYP1A2 structure. When far from the active site, they seem to be implicated in some redox effects through interaction with redox partners of the CYP enzyme. In that case, their control on substrate specificity would be indirect. When located close or at the active site cavity, the control on substrate specificity that these residues exert would be more direct. This result is in agreement with what was obtained on dihydrofolate reductase catalysis and related protein motions [44]. It is of importance to note that steroids are less planar than PAH molecules since the human CYP1A2 structure shows clearly that its active site is fitted for planar ligands [36].
The differential selectivity observed with human CYP1A2 compared to its rabbit ortholog can also be related to a differential recognition of endogenous versus exogenous chemicals. The chemical scaffold of steroid molecules and most of the steroids assayed in this study are endogenous compounds for mammals. However, PAH molecules are all xenobiotics and, hence, exogenous compounds. A physiological consequence of our analyses on both steroids and PAHs suggests that the differential behaviour observed could be related to some effect differentially affecting the evolution of CYP1A genes in mammals. The crucial result of this study indeed shows that recognition rules of PAHs (exogenous molecules) or of steroids (endogenous molecules) are very different for CYP from the same gene subfamily (CYP1A). The evolutionary mechanisms that keep in all mammals two groups of CYP1A genes, the CYP1A1s and the CYP1A2s, and distinguish them by their activity toward PAH xenobiotics, seem irrelevant to maintain at the same time a clear differentiation of the activity toward endogenous substrates. This illustrates the extraordinary adaptability of CYPs to the chemical environment of their host species, while preserving a species-distinctive housekeeping metabolism of endogenous molecules. A differential evolution of substrate specificities in mammalian CYP enzymes could have occurred, revealing that different selection pressures are acting on metabolism of exogenous or endogenous molecules.
When looking at structural features on CYP1A protein, the fact that most of the identified positions differentiating human from rabbit CYP1A2s are located at the surface of the protein is consistent with recent reports showing that surface residues are more akin to transition from one specificity to another by directed evolution [45, 46]. Our results give credit to the new approach of focused directed evolution which combines site-directed mutagenesis and DNA shuffling on site-directed mutants having increased promiscuous activities [47]. It is more and more grounded that surface residues mostly control the spectrum of promiscuous activities that any enzyme exhibits. The difference between rabbit and human CYP1A2s thus suggests that this law could also apply to natural evolution.
The novel approach described in this study takes into consideration global variables deduced from complementary MDS and PCA methods. PCA and MDS not only provide insights into the functional complexity of the data, they also pinpoint the functional classes. These approaches should be put at the core of functional studies due to their power of extracting from large amounts of data the key elements underlying evolution. In protein engineering and directed evolution, substrate specificities of parental enzymes are found relaxed in directed mutants, thus broadening substrate selectivity [48]. Multivariate analyses thus reveal relationships between substrates and enzymes [49,50].
SUPPLEMENTARY MATERIAL
Supplementary material can be viewed at www.bentham.org/open/todmj