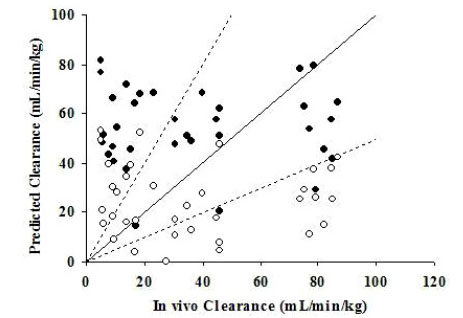
Fig. (2) Plots between in vivo CL and predicted CLin vitro from
mouse S9 calculated from model A (N = 27). ○ represents 10 µM
substrate concentration and ● represents 1 µM substrate concentration.
Solid line represents lines of unity, and the area between the
dot-lines represents an area within 2-fold error.