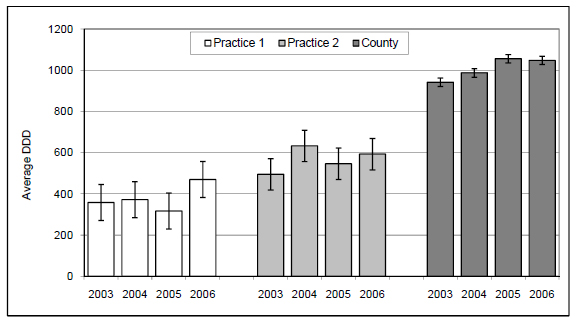
Fig. (1) The total prescription volumes of antipsychotics (N05A) by the two practices participating in the intervention, compared with county figures. The figures are quarterly averages for the given year given in defined daily doses per 1000 patients. Error bars indicate the LSD (Least Significant Difference; (P =. 05)) calculated using analysis of variance (ANOVA) followed by Student-Newmann-Keuls post-ANOVA test.