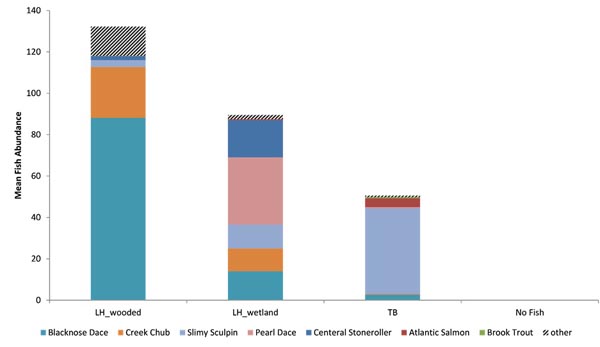
Fig. (4)
Mean fish abundance (fish/50m) within each distinct fish assemblage. The seven most abundant species are shown as individual components of each bar beginning with Blacknose Dace at the bottom. All other species were lumped into the “other” group, which is shown as the top component of each bar. The “No Fish” sample group consisted of the most upstream samples in the Tunison Brook assemblage.