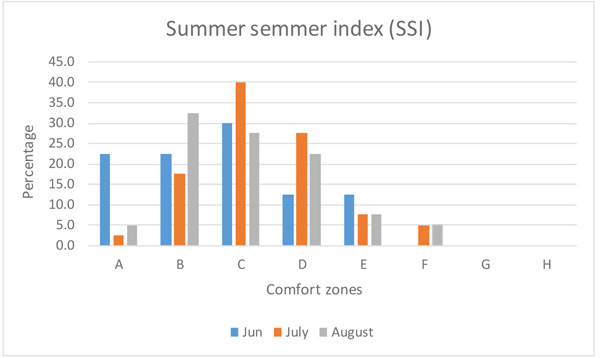
Fig. (4)
Distribution of summer simmer index values in different comfort zones (refer to Table
2
for description of comfort zones).