- Home
- About Journals
-
Information for Authors/ReviewersEditorial Policies
Publication Fee
Publication Cycle - Process Flowchart
Online Manuscript Submission and Tracking System
Publishing Ethics and Rectitude
Authorship
Author Benefits
Reviewer Guidelines
Guest Editor Guidelines
Peer Review Workflow
Quick Track Option
Copyediting Services
Bentham Open Membership
Bentham Open Advisory Board
Archiving Policies
Fabricating and Stating False Information
Post Publication Discussions and Corrections
Editorial Management
Advertise With Us
Funding Agencies
Rate List
Kudos
General FAQs
Special Fee Waivers and Discounts
- Contact
- Help
- About Us
- Search


The Open Electrical & Electronic Engineering Journal
(Discontinued)
ISSN: 1874-1290 ― Volume 13, 2019
The VPF Harmonic Analysis Algorithm Based on Quasi-Synchronous DFT
Zhongjun Fu1, 3, Jianyu Wang1, *, Yun Ou2, Genyuan Zhou3, Feng'e Bai3, Xiaorong Zhao3
Abstract
Background:
The main source of spectral leakage in Quasi-synchronous DFT (QSDFT) harmonic analysis is the short-range leakage resulting from the fluctuating signals.
Objective:
The QSDFT discrete spectrum stretching theorem, as is demonstrated in this paper, shows that the peak in frequency domain changes synchronously with the signal frequency drift. Based on QSDFT, an improved algorithm—Variable Picket Fence (VPF) is proposed.
Method:
The VPF means the sampling position in the frequency domain will synchronously change with the signal frequency drift. In this way, we can accurately capture the spectrum peak, thereby inhibiting short-range spectral leakage. Hence signal frequency drift can be obtained by measuring the fundamental phase difference between the adjacent sample points.
Results:
Simulation and application results prove that this proposed algorithm increases the accuracy of harmonic analysis by inhibiting short-range spectral leakage efficiently in the range of 45 to 55HZ.
Article Information

Identifiers and Pagination:
Year: 2017Volume: 11
First Page: 114
Last Page: 124
Publisher Id: TOEEJ-11-114
DOI: 10.2174/1874129001711010114
Article History:
Received Date: 15/12/2016Revision Received Date: 07/03/2017
Acceptance Date: 20/03/2017
Electronic publication date: 19/07/2017
Collection year: 2017
open-access license: This is an open access article distributed under the terms of the Creative Commons Attribution 4.0 International Public License (CC-BY 4.0), a copy of which is available at: https://creativecommons.org/licenses/by/4.0/legalcode. This license permits unrestricted use, distribution, and reproduction in any medium, provided the original author and source are credited.
* Address correspondence to this author at the School of Automation, Nanjing University of Science and Technology, Nanjing, 210094 China, 200, Xiaolingwei Rd., Nanjing, 210094 China, Tel: +8613951716181; E-mail: jianyu_wang2000@163.com
| Open Peer Review Details | |||
|---|---|---|---|
| Manuscript submitted on 15-12-2016 |
Original Manuscript | The VPF Harmonic Analysis Algorithm Based on Quasi-Synchronous DFT | |
1. INTRODUCTION
Harmonic analysis technology splits complex signals into simple periodic signals to study the nature of things, for that reason, it is widely used in many fields like power quality monitoring, electronic products testing, electrical equipment monitoring, etc. The essence of the above technology is to have an accurate and efficient harmonic analysis algorithm.
At present, the commonly used method for harmonic analysis is Fourier transform (DFT and FFT). In engineering applications, finite points sampling strategy is widely applied to harmonic analysis, and also strictly synchronous sampling is very difficult to achieve that caused by sampling clock error and frequency drift of signals (Synchronous sampling means the sampling frequency always maintains a fixed proportional relationship with the signal frequency. Therefore, when applying DFT and FFT, two source of leakage — long-range leakage caused by truncation effect (finite points sampling) and short-range leakage caused by fence effect (asynchronous sampling) - lead to the inaccuracy and untrustworthy of the analysis [1F.J. Harris, "On the use of windows for harmonic analysis with the discrete Fourier transform", Proc. IEEE, vol. 66, no. 1, pp. 51-83, 1978.
[http://dx.doi.org/10.1109/PROC.1978.10837] -3H. Wen, H.F. Dai, and Z.S. Teng, "Performance comparison of windowed interpolation FFT and quasisynchronous sampling algorithm for frequency estimation", Math. Probl. Eng., vol. 2014, pp. 1-7, 2014.
[http://dx.doi.org/10.1155/2014/103626] ]. For this reason, many solutions have been presented, such as the windowed interpolation algorithm [4H. Wen, Z.S. Teng, Y. Wang, and X.G. Hu, "Spectral correction approach based on desirable sidelobe window for harmonic analysis of industrial power system", IEEE Trans. Ind. Electron., vol. 60, no. 3, pp. 1001-1010, 2013.
[http://dx.doi.org/10.1109/TIE.2012.2189531] -7I.S. Reljin, B.D. Reljin, and V.D. Papic, "Extremely flat-top windows for harmonic analysis", IEEE Trans. Instrum. Meas., vol. 56, no. 3, pp. 1025-1041, 2007.
[http://dx.doi.org/10.1109/TIM.2007.894889] ], Non Harmonic Fourier Analysis [8Y. Hirata, "Non-harmonic Fourier analysis available for detecting very low-frequency components", J. Sound Vibrat., vol. 287, no. 3, pp. 611-613, 2005.
[http://dx.doi.org/10.1016/j.jsv.2005.01.025] -11P. Neri, "Bladed wheels damage detection through non-harmonic fourier analysis improved algorithm", Mech. Syst. Signal Process., vol. 88, pp. 1-8, 2017.
[http://dx.doi.org/10.1016/j.ymssp.2016.11.010] ], and the Quasi-synchronous DFT (QSDFT) [12X.Z. Dai, and R. Gretsch, "Quasi-synchronous sampling algorithm and its applications", IEEE Trans. Instrum. Meas., vol. 43, no. 2, pp. 204-209, 1994.
[http://dx.doi.org/10.1109/19.293421] -18F. Zhou, C.Y. Zhao, and X.Y. Huang, "Zhenyu, “Harmonic and Interharmonic Estimation Using Time-Domain Quasi-Synchronous Sampling Technique and Comb FIR Filter", Int. Review Electric. Eng. IREE., vol. 6, no. 6, pp. 2773-2784, 2011.].
QSDFT has the advantage of easy implementation, short sampling length, small system overhead, etc. However, in practical applications, limitation and defects in algorithms occur. To be more specific, the precision of analysis, particularly that of initial-phase is low when signal frequency drifts [19H.F. Qiu, and H. Zhou, "Study on the approachs of electrical harmonic analysis for asynchronous sampling", Chinese J. Relay, vol. 36, no. 1, pp. 57-62, 2008.]. In this paper, based on the Discrete Spectrum Stretching Theorem, the concept of Variable Picket Fence (VPF) is proposed. After that we put forward an improved algorithm of QSDFT, namely VPF. Simulation and application results show that this algorithm is valid.
2. ANALYSIS OF QSDFT
2.1. The QSDFT
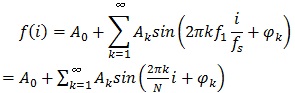
Consider a periodic signal f (t)
 |
(1) |
Where: k is the harmonic order; Ak and k are amplitude and initial-phase of the k-th harmonic; f1 is the frequency of f (t).
According to the sampling frequency fS and the number of sampling points within a cycle N, in the range of [t 0, t 0 + W × TS] uniformly-spaced sampling W+1 times to obtain the sampled sequence f(i), i = 0 to W. Where W is determined by the integral method, W = n N when using Trapezoidal integration methods; n is the number of iterations.
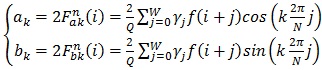
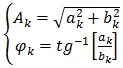
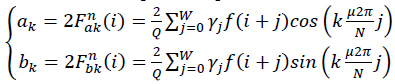
Appling Eq. (2) and (3) to calculate the real part ak, the imaginary part bk, Ak and φk of the k-th harmonic, this is QSDFT [12X.Z. Dai, and R. Gretsch, "Quasi-synchronous sampling algorithm and its applications", IEEE Trans. Instrum. Meas., vol. 43, no. 2, pp. 204-209, 1994.
[http://dx.doi.org/10.1109/19.293421] ].
 |
(2) |
 |
(3) |
Where: i is the start sampling point, normally i = 0; γj is the weighting coefficient, determined by the integral method, n and
 is the sum of all weighting coefficients, and Q = (N+1)n when W = nN.
2.2. The Inhibition of Long-Range Spectral Leakage by QSDFT
The signal used for harmonic analysis comes from rectangular window truncation of the infinite length signal which duration is T = NTS, TS = 1/fs and that leads to the spectral leakage of Fourier transform.
As to a sinusoidal signal f (t) = sin (100 πt) and N = 128, its DFT value can be retrieved from frequency domain at fixed sampling frequency , as is shown in Fig. (1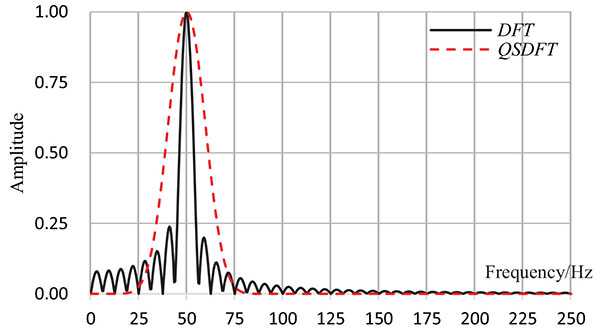 ). The analog frequency corresponding to 2π/N is fs/N. Fig. (1) illustrates that the discrete amplitude spectrum is no longer a single peak, instead countless peaks of varying sizes distribute in the entire frequency axis. In other words, the energy of frequency spectrum is leaked and no longer concentrated, which is commonly named long-range leakage. In the process of harmonic analysis, the leaked energy from each harmonic will affect each other, and cause analysis error [1F.J. Harris, "On the use of windows for harmonic analysis with the discrete Fourier transform", Proc. IEEE, vol. 66, no. 1, pp. 51-83, 1978.
[http://dx.doi.org/10.1109/PROC.1978.10837] ].
For QSDFT, the main lobe of the discrete spectral is widened and the side lobe will be suppressed under the convergence of quasi-synchronous sampling. Fig. (1). shows the discrete amplitude spectrum of QSDFT, where the number of iterations n = 8, the main lobe is converged and the mutual influence of leaked energy from each harmonic is trivial. From this perspective, the quasi-synchronous sampling can be treated as a good window function and it can inhibit long-range leakage significantly, so sometimes it is also referred to as quasi-synchronous window [19H.F. Qiu, and H. Zhou, "Study on the approachs of electrical harmonic analysis for asynchronous sampling", Chinese J. Relay, vol. 36, no. 1, pp. 57-62, 2008.].
 |
Fig. (1) The discrete spectrum of DFT and QSDFT. |
2.3. The Influence of Signal Frequency Deviation on QSDFT
In practical measurement, considering the influence of multi-factors - precision of sampling clock, integer multiple error of sampling clock, frequency drift of signals - it is difficult to implement exact whole-cycle synchronous sampling. The above factors lead to the short-range leakage of discrete spectrum, of which the causes can mainly be attributed to the frequency drift of signals. In theory, based on the convergence characteristics of multiple iterations, QSDFT can suppress the short-range leakage caused by frequency drift. However, in practical applications, the inhibitory effect on the short-range leakage is not significant.
Fig. (2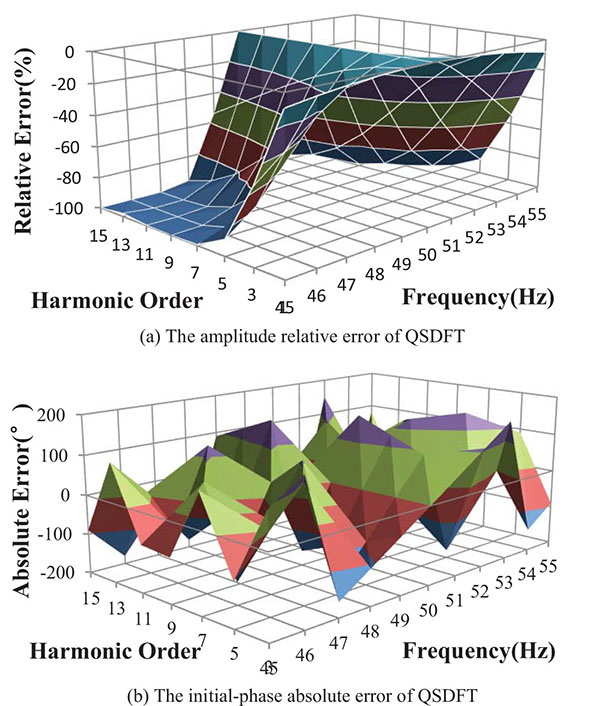 ) shows the QSDFT harmonic analysis error (number of iterations n=5) of the waveforms generated from Eq. (4).
 |
(4) |
Where: A2k-1 and ϕ2k-1 are arbitrary; f1 = 45 to 55Hz; Amplitude Relative Error = (Analyzed - Theoretical) / Theoretical* 100%; Initial-phase Absolute Error = (Analyzed - Theoretical).
As is in Fig. (2), high analytical precision of the amplitude of QSDFT occurs only in the range of 50Hz ± 1%, and the maximum relative error of the amplitude nearly reach 100% when in the range from 45 to 55Hz. It suggests that initial-phase from QSDFT is untrustworthy except when it is close to original frequency. For that reason, QSDFT can be applied only to such occasions with small signal frequency drift and low amplitude precision requirements, and it is not suitable for initial-phase analysis.
3. THE IMPROVED ALGORITHM OF QSDFT ANALYSIS OF QSDFT
3.1. Discrete Spectrum Stretching Theorem
Definition: The rate of signal frequency deviation , is the degree of the signal frequency drift, which is defined as follows:
 |
(5) |
If the signal frequency does not drift, µ = 1; and if the signal frequency drifts, μ ≠ 1.
Assume that sampling frequency fS and N is fixed, the sampled sequence fi acquired from Eq. (1) is as follows:
 |
(6) |
 |
Fig. (2) The harmonic analysis errors of QSDFT (n=5). |
The frequency spectrum function of x-th harmonic is:
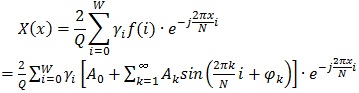 |
(7) |
If the signal frequency has deviated µ,the sampled sequence f* (i) is:
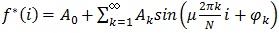 |
(8) |
Thus, the corresponding frequency spectrum function of x-th harmonic is:
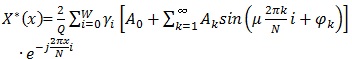 |
(9) |
Compare Eq. (7) and Eq. (9) can be obtained:
 |
(10) |
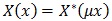
Eq. (10) means, if signal frequency has deviated µtimes, then the discrete spectrum of QSDFT is stretched μ times along the frequency axis, and the discrete spectrum peak of the k-th harmonic will appear in the position of kµf1 from kf1 (Fig. 3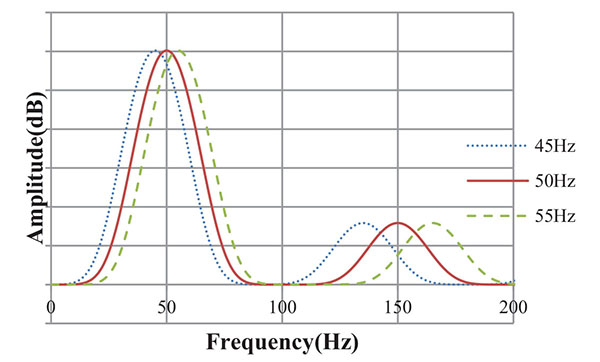 ).
).
 |
Fig. (3) The discrete amplitude spectrum of QSDFT with the signal frequency drift. |
 |
Fig. (4) The variable picket fence. |
3.2. The Concept of Variable Picket Fence
Eq. (10) shows that the signal frequency drift will let the spectral peak deviated from the ideal position. When the signal frequency drift occurs, there will be great error if the sampling position in frequency domain still is 2π/N (the corresponding analog frequency fs/N). For example, when f1 = 55HZ, µ = 1.1, and the fundamental peak position is Nf1/fs = 1.1. However, in accordance with frequency domain sampling position 2π/N, the fundamental information obtained from Nf1/fs = 1 is inaccurate. If μ can be accurately estimated, and we can adjust frequency domain sampling position to µ2π/N (the corresponding analog frequency µfS/N), the amplitude and initial-phase information of the fundamental and the k-th harmonic will be obtained accurately (Fig. 4 ).
).
So, the improved equation is:
 |
(11) |
Variable Picket Fence (VFP) is a modified algorithm in which the frequency domain sampling position is not fixed, instead the position changes with the signal frequency drift. So VPF can accurately estimate the peak position of each harmonic, thereby obtain high precision results of the amplitude and initial-phase.
3.3. The Rate of Signal Frequency Deviation μ
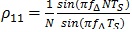
Suppose
 , and n is a large number, and the following equations can be deduced from [20X. Z. Dai, and T. Y. Tang, "Quasi-synchronous sampling algorithm and its applications-Part 3: High accurate measurement of frequency, frequency deviation, and phase angle difference in power systems", in Proceeding. IEEE IMTC/93,, pp. 726-729, .]:
 |
(12) |
Where: M is the maximum harmonic order,
 |
(13) |
 |
(14) |
The fundamental initial-phase φ1(i) analyzed by QSDFT from the i-th sampling point, is:
 |
(15) |
As to two adjacent sampling points, the fundamental initial-phase difference:
 |
(16) |
Eq. (16) means, although the fundamental initial-phase acquired by QSDFT is totally incorrect when the signal frequency drifts, the fundamental phase difference between adjacent sampling points is fixed, and it is only interrelated with the signal frequency f1 and the sampling frequency fS.
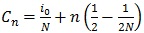
For engineering applications, the fundamental initial-phase φ1(0) and φ1(1) of the two adjacent sampling points can be calculated from two starting points i = 0 and i = 1 with Eq. (2), so µ is
 |
(17) |
3.4. The Analysis Process of VFP
According to the Eq. (11) and (17), the analysis process of VFP consists of five steps:
- Sampling W + 2 data. Standard QSDFT algorithm requires sampling W + 1 points, but due to the needs of two starting points i = 0 and i = 1, adding one more sampling point for VFP is necessary.
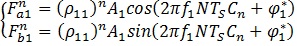
- Calculating Fna1 (0) and Fnb1 from i = 0 by Eq. (2).
- Calculating Fna1 (1) and Fna1 from i = 1 by Eq. (2).
- Calculating µ by Eq. (17).
- Calculating the amplitude and the initial-phase of each harmonic by Eq. (11).
If it is necessary, we can calculate the frequency of each harmonic according to μ and the sampling frequency fS.
4. SIMULATION
We generated some waveform signals from Eq. (3) to verify the effectiveness of VPF. The signal frequency drifts from 45 to 55Hz, and we measured the signal with fS = 6400Hz, N = 128, and the number of iterations n = 5 to 8.
4.1. The Simulation Results of μ
The analysis accuracy of VPF is directly dependent on the precision of μ. The μ relative error from VPF is given in Table (1). The simulation results show the high accuracy of μ is available.
4.2. The Simulation Results of Amplitude
Due to pages limitation, only the simulation error figures of the amplitude and initial-phase from VPF are given. Fig. (5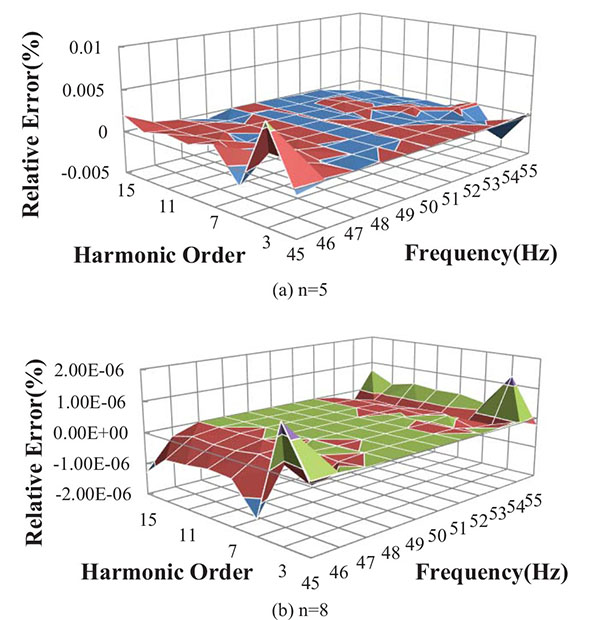 ) shows the relative error of the amplitude. If n = 5, the maximum amplitude error equals to 0.0059632%; if n = 8, the maximum amplitude error equals to -0.0000015%.
4.3. The Simulation Results of Initial-Phase
Fig. (6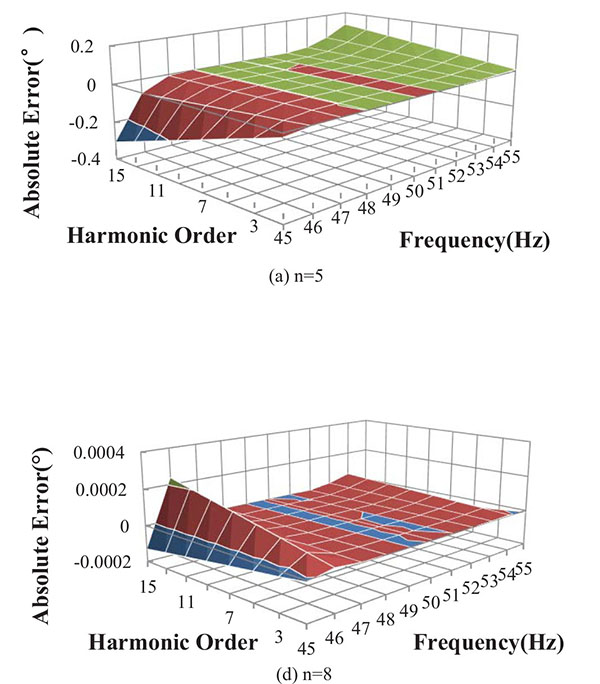 ) illustrates the simulation absolute error of the initial-phase from VPF. If n = 5, maximum initial-phase error equals to -0.3083002°; if n = 8, the maximum initial-phase error equals to 0.0002375°.
4.4. Analysis of Simulation Results
The following conclusions can be drawn from the simulation results:
- The amplitude and initial-phase obtained from VPF have a high precision.
- The number of iterations n has great impact on the analysis accuracy. With the increase of n, the analysis precision increases for almost one order of magnitude. The higher n selected by the system, the more accurate analysis results will be achieved.
- With the drift of the signal frequency, the analysis errors of μ, amplitude and initial-phase increases, and VPF has higher analysis accuracy within 47 to 53Hz.
- The analysis accuracy of the high-order harmonic is lower than the low-order harmonics, but it is not evident in the range from 47 to 53Hz.
The main source of the VPF analysis error is the tiny leak of the discrete spectrum caused by non-integer-period sampling, but this shortcoming can be compensated by increasing the number of iterations.
 |
Fig. (5) The amplitude errors of VPF. |
 |
Fig. (6) The initial-phase errors of VPF. |
5. APPLICATION
For evaluating the performance of the VPF in practice, we embedded VFP to a measuring device JCQ-5 (Fig. 7a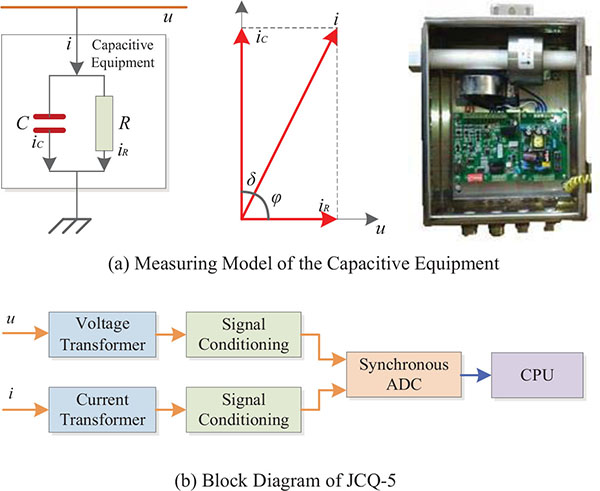 ), which is designed to monitor the capacitive equipment online. The capacitive equipment is an important equipment in the power grid, usually requires online monitoring of its current i, and dissipation angle δ or dissipation factor tanδ to evaluate its current status (Fig. 7a).
 |
Fig. (7) The measuring device JCQ-5. |
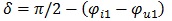 |
(18) |
Where: ϕi1 and ϕu1 respectively.
JCQ-5 consists of four parts: Voltage / Current Transformer, Signal Conditioning, Synchronous ADC AD7606, and CPU STM32F103 (Fig. 7b). JCQ-5 sampling i and u synchronously; and in this device, we set fs = 6400 HZ, N = 128, n = 8. It calculates the Ai1 (fundamental amplitude of i), ϕi1, ϕu1, δ and tanδ.
For comparison, we embedded the FFT, QSDFT, and VPF into JCQ-5, and recorded data 72 hours continuously to analyze the effectiveness of these algorithms. Their performance is shown in Fig. (8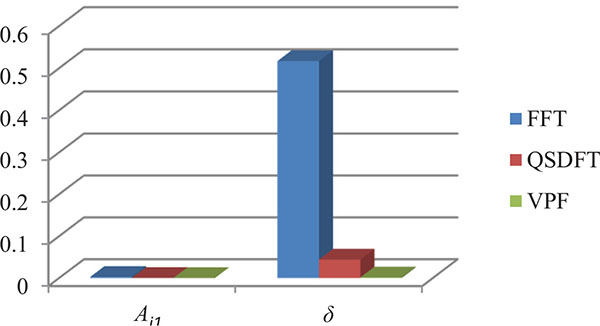 ) and Table 2.
 |
Fig. (8) Mean Square Error of A1i and δ. |
Fig. (8) gives an intuitive illustration of the comparison, and Table II demonstrates the measurement values from these algorithms. It can be noticed that the measurement accuracy of the raw FFT is the comparatively inferior in these methods, and the VPF has an advanced performance.
CONCLUSION
- Compared to QSDFT, VPF inhibited the short-range spectral leakage efficiently, loosed the requirements for synchronous sampling, and increased the analytical accuracy of amplitude, initial-phase and frequency of each harmonic significantly.
- Only increasing one sampling point and two calculation of fundamental initial-phase on the basis of QSDFT, the higher analytical precision will be obtained by VPF.
- The scale of calculation is increased correspondingly in the process of VPF, and on the other hand real-time computation is difficult to implement.
- For a harmonic analysis device working in non-real-time mode, VPF has many advantages, such as less sampling points, high precision, easy implementation, and it can be transplanted to the existing hardware system directly. Thus it is a high practical algorithm.
CONFLICT OF INTEREST
The authors declare no conflict of interest, financial or otherwise.
ACKNOWLEDGEMENTS
The authors would like to thank the Associate Editor and the reviewers for their helpful comments, which improved the quality of this paper.
REFERENCES
| [1] | F.J. Harris, "On the use of windows for harmonic analysis with the discrete Fourier transform", Proc. IEEE, vol. 66, no. 1, pp. 51-83, 1978. [http://dx.doi.org/10.1109/PROC.1978.10837] |
| [2] | V.K. Jain, W.L. Collins, and D.C. Davis, "High-accuracy analog measurements via interpolated FFT", IEEE Trans. Instrum. Meas., vol. IM-28, no. 2, pp. 113-122, 1979. [http://dx.doi.org/10.1109/TIM.1979.4314779] |
| [3] | H. Wen, H.F. Dai, and Z.S. Teng, "Performance comparison of windowed interpolation FFT and quasisynchronous sampling algorithm for frequency estimation", Math. Probl. Eng., vol. 2014, pp. 1-7, 2014. [http://dx.doi.org/10.1155/2014/103626] |
| [4] | H. Wen, Z.S. Teng, Y. Wang, and X.G. Hu, "Spectral correction approach based on desirable sidelobe window for harmonic analysis of industrial power system", IEEE Trans. Ind. Electron., vol. 60, no. 3, pp. 1001-1010, 2013. [http://dx.doi.org/10.1109/TIE.2012.2189531] |
| [5] | J. Wu, and W. Zhao, "A simple interpolation algorithm for measuring multi-frequency signal based on DFT", Measurement, vol. 42, no. 2, pp. 322-327, 2009. [http://dx.doi.org/10.1016/j.measurement.2008.06.008] |
| [6] | A. Ferrero, S. Salicone, and S. Toscani, "A fast, simplified frequencydomain interpolation method for the evaluation of the frequency and amplitude of spectral components", IEEE Trans. Instrum. Meas., vol. 60, no. 5, pp. 1579-1587, 2011. [http://dx.doi.org/10.1109/TIM.2010.2090051] |
| [7] | I.S. Reljin, B.D. Reljin, and V.D. Papic, "Extremely flat-top windows for harmonic analysis", IEEE Trans. Instrum. Meas., vol. 56, no. 3, pp. 1025-1041, 2007. [http://dx.doi.org/10.1109/TIM.2007.894889] |
| [8] | Y. Hirata, "Non-harmonic Fourier analysis available for detecting very low-frequency components", J. Sound Vibrat., vol. 287, no. 3, pp. 611-613, 2005. [http://dx.doi.org/10.1016/j.jsv.2005.01.025] |
| [9] | A. Oberholster, and P. Heyns, "A study of the non-harmonic fourier analysis technique", In: Proceedings of the 21st International Congress on Condition Monitoring and Diagnostic Engineering Management, 2008, pp. 361-370. |
| [10] | P. Neri, and B. Peeters, "Non-harmonic fourier analysis for bladed wheels damage detection", J. Sound Vibrat., vol. 356, pp. 181-194, 2015. [http://dx.doi.org/10.1016/j.jsv.2015.06.048] |
| [11] | P. Neri, "Bladed wheels damage detection through non-harmonic fourier analysis improved algorithm", Mech. Syst. Signal Process., vol. 88, pp. 1-8, 2017. [http://dx.doi.org/10.1016/j.ymssp.2016.11.010] |
| [12] | X.Z. Dai, and R. Gretsch, "Quasi-synchronous sampling algorithm and its applications", IEEE Trans. Instrum. Meas., vol. 43, no. 2, pp. 204-209, 1994. [http://dx.doi.org/10.1109/19.293421] |
| [13] | F. Zhou, Z.Y. Huang, C.Y. Zhao, X.M. Wei, and D.Y. Chen, "Time-domain quasi-synchronous sampling algorithm for harmonic analysis based on newton’s interpolation", IEEE Trans. Instrum. Meas., vol. 60, no. 8, pp. 2804-2812, 2011. [http://dx.doi.org/10.1109/TIM.2011.2118890] |
| [14] | G. Waldemar, "Kürten ihlenfeld, enrico mohns, M. serra, kristian dauke, and andreas suchy, “quasi-synchronous microcontroller-based highly accurate digital sampling of AC signals", IEEE Trans. Instrum. Meas., vol. 56, no. 2, pp. 414-417, 2007. [http://dx.doi.org/10.1109/TIM.2007.891039] |
| [15] | Z.J. Fu, G.Y. Zhou, and J.F. Chen, "Non-integral harmonic analysis algorithm based on quasi-synchronous DFT", Yiqi Yibiao Xuebao, vol. 33, no. 1, pp. 235-240, 2012. |
| [16] | J. Yu, H. Xue, and B. Wen, "A novel non-synchronous sampling method for harmonic/interharmonic measurement in power systems", Intelligent Automation & Soft Computing, vol. 18, no. 5, pp. 491-500, 2012. [http://dx.doi.org/10.1080/10798587.2012.10643259] |
| [17] | G.F. Shen, and Q. Wang, "Designed plan for improving accuracy of quasi-synchronous sampling harmonics analysis", Yiqi Yibiao Xuebao, vol. 22, no. 5, pp. 455-457, 2001. |
| [18] | F. Zhou, C.Y. Zhao, and X.Y. Huang, "Zhenyu, “Harmonic and Interharmonic Estimation Using Time-Domain Quasi-Synchronous Sampling Technique and Comb FIR Filter", Int. Review Electric. Eng. IREE., vol. 6, no. 6, pp. 2773-2784, 2011. |
| [19] | H.F. Qiu, and H. Zhou, "Study on the approachs of electrical harmonic analysis for asynchronous sampling", Chinese J. Relay, vol. 36, no. 1, pp. 57-62, 2008. |
| [20] | X. Z. Dai, and T. Y. Tang, "Quasi-synchronous sampling algorithm and its applications-Part 3: High accurate measurement of frequency, frequency deviation, and phase angle difference in power systems", in Proceeding. IEEE IMTC/93,, pp. 726-729, . |